Figure 1.

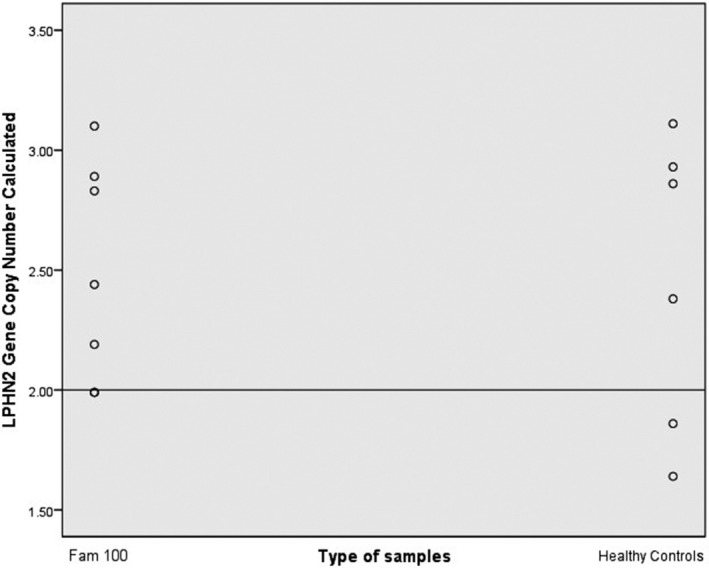
Scatter plot indicated LPHN2 copy number value in Family 100 in comparison to the normal controls. The straight line depicted the calibrator set value at 2

Scatter plot indicated LPHN2 copy number value in Family 100 in comparison to the normal controls. The straight line depicted the calibrator set value at 2