
Figure 2.
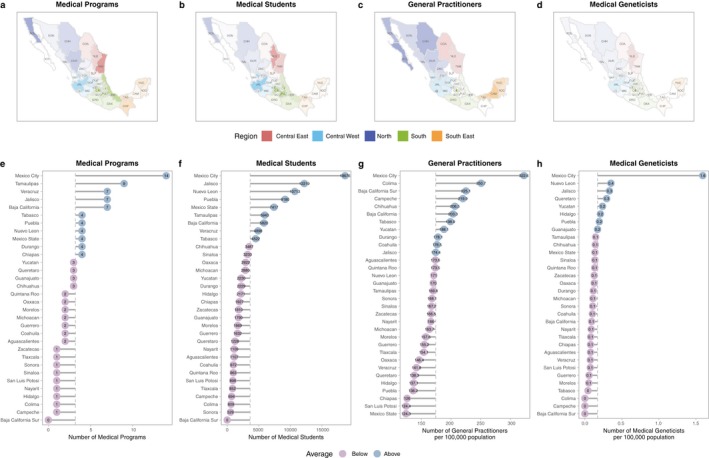
Medical programs and genetics workforce by state in the map (a,b,c,d) and lollipop plots (e,f,g,h). The panels show (a, b) Number of medical programs (AMFEM, 2017); (b, f) Total number of enrolled medical students (ANUIES, 2017); (c, g) Physicians by state (statistic yearbooks by state, INEGI 2017) (d, h) Unique medical geneticists from all four sources (CMGAC, Infogen, Seccion Amarilla, Doctoralia)