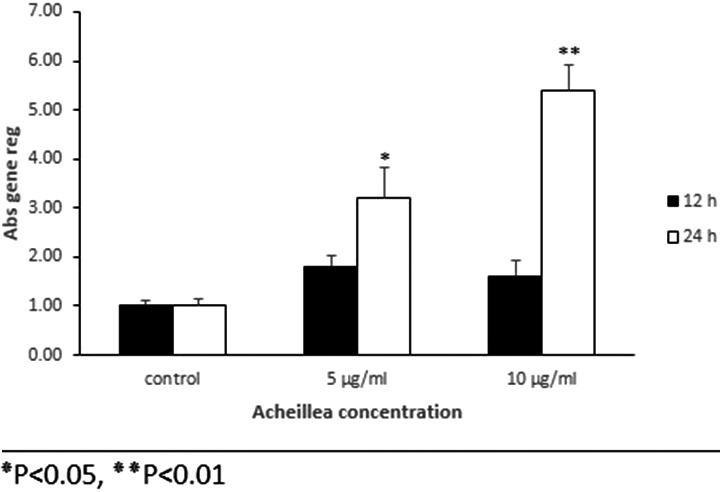
Figure 5.

Relative expression of bFGF gene in mouse embryonic fibroblast cell that were treated with various concentration of Achillea compared to control group at different time intervals treatment (12 and 24 hr). Mouse embryonic fibroblast cells were treated with Achillea (5 and 10 µ) and the expression of bFGF gene was assessed by quantitative real time PCR. All comparisons were compared to the control group (p < 0.05)
