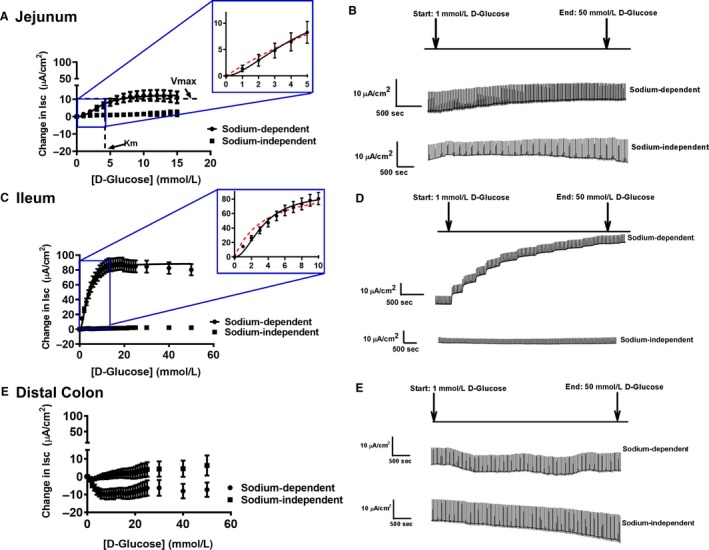
Figure 1.

Sigmoidal kinetics for sodium‐dependent electrogenic glucose transport in the (A) jejunum, with the inset representing exemplary fits for Michaelis–Menten (red dotted line) and sigmoidal/Hill kinetics (black solid line). The representative traces are illustrated on the right side (B) (sodium‐dependent: Pig N = 11; sodium‐independent: pig N = 3). (C) Sigmoidal kinetics for the ileum, with the inset representing exemplary fits for Michaelis–Menten (red dotted line) and sigmoidal/Hill kinetics (black solid line). The representative traces are illustrated on the right side (D) (sodium‐dependent: pig N = 13; sodium‐independent: pig N = 3). (E) No kinetics observed in the distal colon, illustrated with representative traces on the right side (F) (sodium‐dependent: Pig N = 13; sodium‐independent: pig N = 3). The V max and K m is represented in the (A) jejunum for illustration purposes. Data are represented as means ± SEM.
