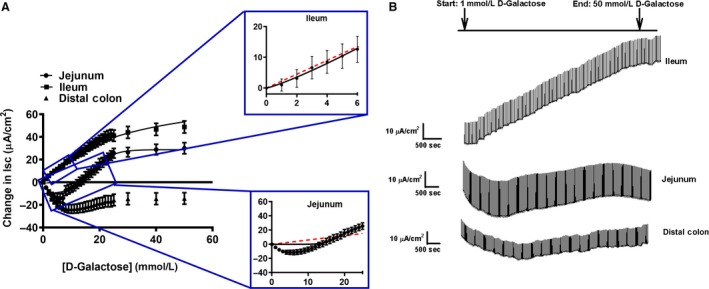
Figure 2.

Sigmoidal kinetics for sodium‐dependent electrogenic galactose transport in the (A) jejunum, ileum, and colon. The inset for the jejunum (top) and ileum (bottom) represents exemplary fits for Michaelis–Menten (red dotted lines) and sigmoidal/Hill kinetics (black solid line). The representative traces are illustrated on the right side (B) (pig: jejunum: N = 5, ileum: N = 6, distal colon: N = 6). Data are represented as means ± SEM.
