Figure 2.
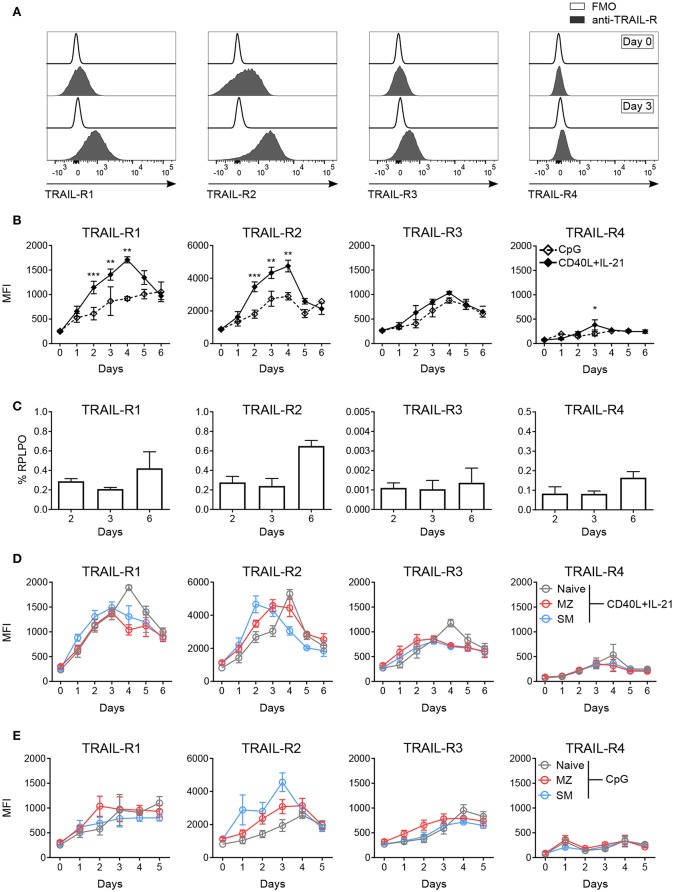
In vitro activation induces TRAIL-R expression in human B cells. Expression of TRAIL-Rs was analyzed by flow cytometry and RT-qPCR in in vitro activated human B cells isolated from PBMCs. (A) Representative histograms depict expression of TRAIL-Rs in CD19+ live B cells at day 0 and at day 3 after stimulation with CD40L+IL-21 compared to respective fluorescent minus one (FMO) controls. (B) Quantification of TRAIL-R expression in CD19+ live B cells upon stimulation with CpG or CD40L+IL-21 up to day 6 of culture depicted as MFI (n ≥ 3). (C) RT-qPCR analysis of all TRAIL-R transcripts in isolated CD19+ B cells upon stimulation with CD40L+IL-21 at day 2, 3 and 6 (n = 3). (D) TRAIL-R expression in naïve, MZ and SM B cells upon T cell-dependent (CD40L+IL-21) activation up to day 6 of culture shown as MFI (n ≥ 3). (E) TRAIL-R expression in naïve, MZ and SM B cells upon T cell-independent (CpG) stimulation up to day 5 of culture depicted as MFI (n ≥ 3). Mean values ± SEM (B,D,E) or ± SD (C) are shown. n, biological replicates. (B) *p < 0.05; **p < 0.01; ***p < 0.001. Statistical analysis was done with two-tailed unpaired Student's t-test.

