
Figure 4.
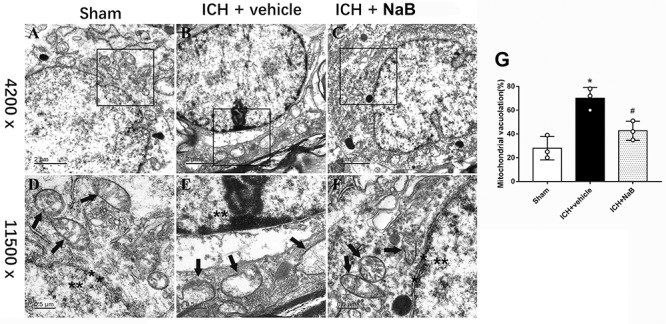
Transmission electron microscopy images of the morphometric changes of brain tissues. (A) Sham; (B) ICH + vehicle; (C) ICH + NaB (scar bar = 2 μm); (D–F) Magnification of (A–C) (scar bar = 0.5 μm); (G) The quantification of mitochondrial vacuolation rate. ∗p < 0.05 vs. sham, #p < 0.05 vs. ICH + vehicle at 24 h, n = 3 per group. Mitochondria (black arrows) with prominent cristae and an intact membrane and nucleus (asterisk) with a clear membrane and homogenous chromatin was observed in sham group. The induction of ICH results in irregular mitochondria with damaged cristae and condensed chromatin. However, NaB administration notably reversed the results.