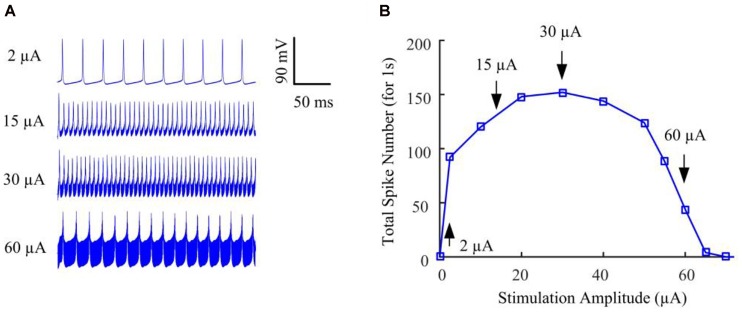
FIGURE 2.
The RGC model exhibited strength-dependent responses to constant-amplitude 2-kHz HFS. (A) Somatic voltage recordings for stimulation amplitudes of 2, 15, 30, and 60 μA. Larger stimulation amplitude was accompanied by increasing stimulation artifacts. (B) We counted the number of evoked spikes at the soma over a range of stimulus amplitudes. At relatively low stimulus magnitudes (i.e., <30 μA), RGC spiking activity at the soma typically increased with stimulus amplitude. However, as the stimulus strength increased further (i.e., from 30 to 70 μA), the elicited spike count decreased substantially, creating a non-monotonic response profile as a function of stimulus amplitude. Arrows with index numbers correspond to the spiking profiles in panel A.

