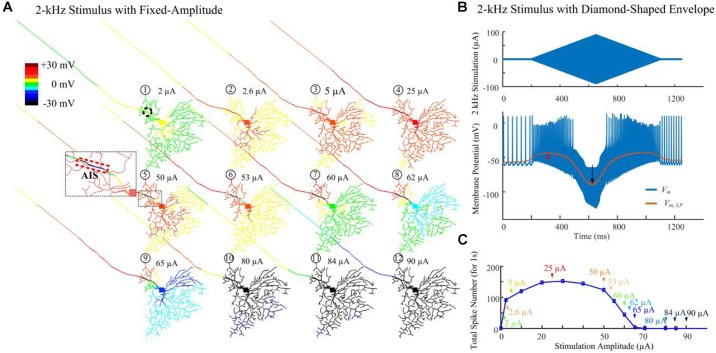
FIGURE 3.
Modeled spike suppression using high-amplitude 2-kHz HFS. (A) The relative membrane depolarization and hyperpolarization (Vm,LP – Vrest) induced by constant-amplitude 2-kHz extracellular stimulation immediately following eighty stimulus pulses (40 ms from stimulus onset). Here the membrane potential changes were low-pass filtered to better represent the low-amplitude, long-duration changes during and after HFS. Small amplitude pulses (2 μA) only depolarized neurites near the electrode (dashed circle). When pulses of 50 μA were delivered, local hyperpolarization was apparent at the AIS and neighboring regions (indicated by the zoomed subplot) while the soma and dendrites were still depolarized (region with warm colors). The spatial extent of hyperpolarized regions progressively increased with higher stimulation amplitudes. (B) Transient HFS-induced membrane depolarization (red arrow) and hyperpolarization (black arrow) under 2 kHz diamond envelope stimulations (900 ms duration, 2 μA baseline with a peak of 90 μA). (C) Number of somatic spikes evoked with a 1-s, 2-kHz HFS over a range of stimulus amplitudes. Index numbers and arrows correspond to each subplot in panel A.

