. 2019 Apr 1;7(5):e622. doi: 10.1002/mgg3.622
© 2019 The Authors. Molecular Genetics & Genomic Medicine published by Wiley Periodicals, Inc.
This is an open access article under the terms of the http://creativecommons.org/licenses/by/4.0/ License, which permits use, distribution and reproduction in any medium, provided the original work is properly cited.
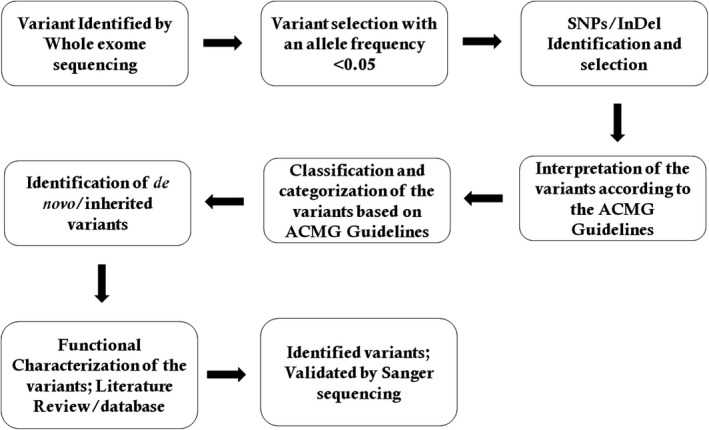
Figure 2.

Data interpretation pipeline
