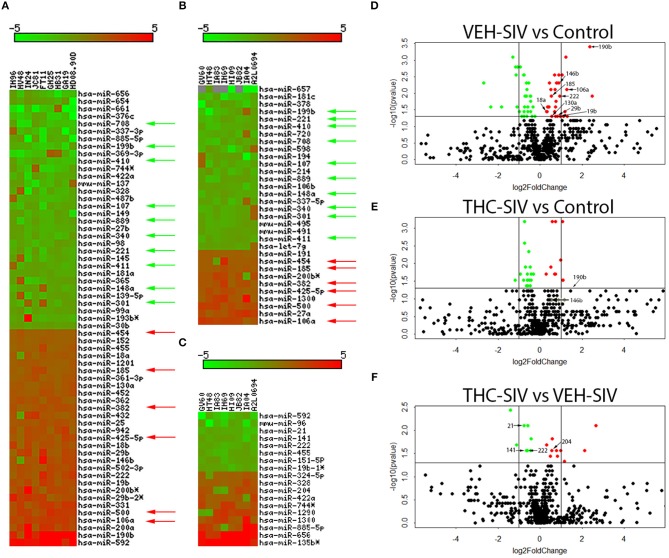
Figure 1.
Changes in miRNA expression in whole colon tissue of chronically SIV-infected rhesus macaques administered vehicle (VEH) or delta-9-tetrahydrocannabinol (Δ9-THC). The heat map shows all differentially expressed (p ≤ 0.05) miRNAs in whole colon tissue of VEH/SIV vs. controls (A), THC/SIV vs. controls (B), and VEH/SIV vs. THC/SIV (C). MiRNA species originating from the opposite arm of the precursor are denoted with an asterisk (*). Volcano plot shows the relationship between fold-change (X-axis) and statistical significance (Y-axis) of differentially expressed miRNAs in VEH/SIV (D) and THC/SIV (E) rhesus macaques relative to controls and in THC/SIV relative to VEH/SIV rhesus macaques (F). The vertical lines in (D–F) correspond to 2.0-fold up and down, respectively, and the horizontal line represents p ≤ 0.05. The negative log of statistical significance (p-value) (base 10) is plotted on the Y-axis, and the log of the fold change base (base 2) is plotted on the X-axis in (D–F). Green and red arrows indicate, respectively, downregulated and upregulated miRNAs common to VEH/SIV and THC/SIV rhesus macaques. The location of miRNAs of interest is denoted with arrows in (D–F) without the prefix (miR) due to space limitations.

