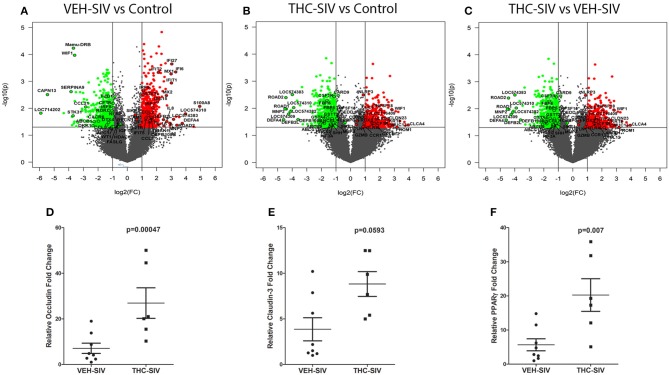
Figure 2.
Changes in mRNA expression in the whole colon tissue of chronically SIV-infected rhesus macaques administered vehicle (VEH) or delta-9-tetrahydrocannabinol (Δ9-THC). Volcano plot shows the relationship between fold-change (X-axis) and statistical significance (Y-axis) of differentially expressed mRNAs in VEH/SIV (A) and THC/SIV (B) rhesus macaques relative to controls and in THC/SIV relative to VEH/SIV rhesus macaques (C). The vertical lines in (A–C) correspond to 2.0-fold up and down, respectively, and the horizontal line represents p ≤ 0.05. The negative log of statistical significance (p-value) (base 10) is plotted on the Y-axis, and the log of the fold change base (base 2) is plotted on the X-axis. All differentially expressed mRNAs listed in Supplementary Tables 5–10 are listed and highlighted with a black outer border in (A–C). RT-qPCR confirmation of OCLN (D), CLDN3 (E), and PPARγ (F) mRNA expression in the jejunal epithelium of THC/SIV compared to VEH/SIV rhesus macaques. The RT-qPCR analysis was performed twice, and the data were analyzed using the non-parametric Wilcoxon's rank sum test for independent samples. The error bars represent standard error of mean fold change within each group.

