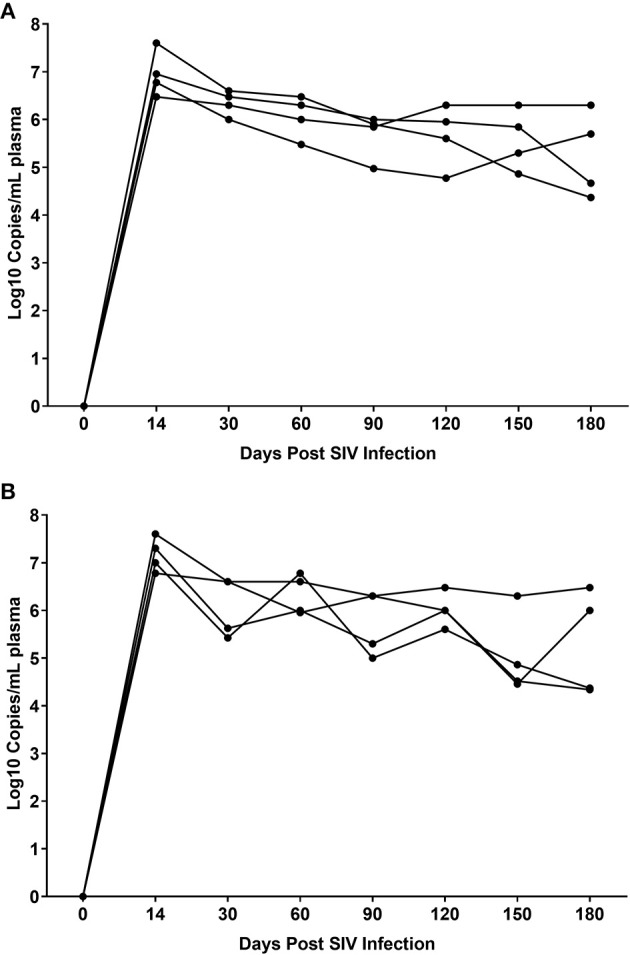
Figure 6.

Plasma viral loads in VEH/SIV (A) (n = 4) and THC/SIV (B) (n = 4) rhesus macaques through the course of SIV infection. Viral load measurements were performed once using 1-step RT-qPCR using four individual animals as biological replicates per group. Differences between groups at each post infection time point were analyzed using the Mann-Whitney U test employing the Prism v5 software (GraphPad software). Note the similarity in peak plasma viremia in both groups at 14 days post SIV infection. No statistical differences in plasma viral loads were detected between the two groups at all post infection time points.
