Figure 7.
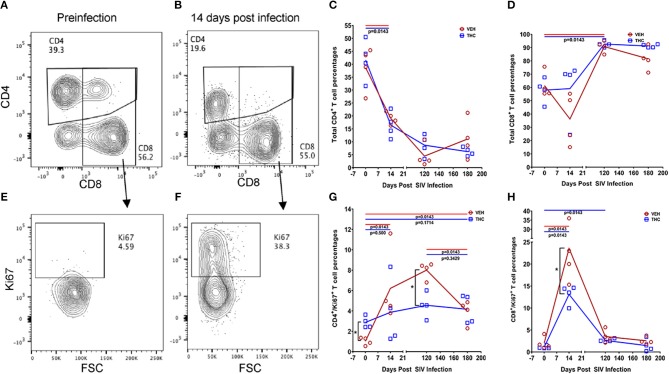
Delta-9-tetrahydrocannabinol (Δ9-THC) administration regulates intestinal T cell proliferation/activation in SIV infection. A representative contour plot shows single positive CD4+ and double positive CD4+/CD8+ T cell depletion in the intestine at 14 days post infection in a VEH/SIV rhesus macaque (A,B). All acquired cells were first gated on singlets, followed by CD45+ and live cells. All live cells were further gated for CD3+ and CD20+ cells, where T cells were defined by gating for CD3+ T-cells. Finally, CD3+ T cells were analyzed for the presence of CD4+ and CD8+ phenotype. Total CD4+ T cell percentages are significantly reduced in intestines of both VEH/SIV and THC/SIV rhesus macaques as early as 14 days post-infection and remained low throughout the study period (C). In contrast, total CD8+ T cell percentages were significantly increased in both VEH/SIV and THC/SIV rhesus macaques (D) at 120 days post-SIV infection. Contour plot shows CD8+ T cell proliferation/activation based on high Ki67 expression at 14 days post-SIV infection compared to the preinfection time point in a VEH/SIV rhesus macaque (E,F). Within the gated CD4+ T cell population, note the significantly attenuated CD4+ T cell proliferation based on Ki67 expression in THC/SIV but not VEH/SIV rhesus macaques (G) at 14, 120-, and 180-days post-SIV infection compared to their respective preinfection levels. Similarly, Δ9-THC significantly attenuated CD8+ T cell proliferation/activation associated with peak viral replication at 14 days post-SIV infection compared to VEH/SIV rhesus macaques (H). Open red circles- VEH/SIV, Open blue squares- THC/SIV. Horizontal red and blue lines with P-values denote comparisons between time points within the VEH/SIV and THC/SIV groups, respectively. Left black brackets with an asterisk indicate statistical significance (p = 0.0143) between the VEH/SIV and THC/SIV groups for a given time point. Connecting blue and red lines (C,D,G,H) denote mean values of the respective population in the THC/SIV and VEH/SIV groups, respectively. Flow cytometry analysis to determine the effect of Δ9-THC on total CD4+ and CD8+ T cells and Ki67 expression in SIV-infected rhesus macaques was performed once with four individual animals as biological replicates per group. Flow cytometry data were analyzed using linear mixed models with immune-marker outcomes being dependent variables, and treatment status (VEH vs. Δ9-THC) and days since the start of treatment (0, 14, 120, 180) being independent variables with fixed effects. Differences between two time points were analyzed using the Mann-Whitney U-test employing the Prism v5 software (GraphPad software). A p-value of ≤0.05 was considered significant.

