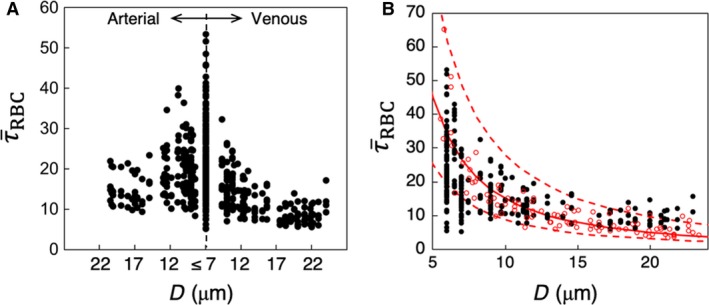
Figure 3.

(A) Predicted in all vessels in the simulated networks, in dyne/cm2. (B) Comparison of predicted ( ) with in vivo data (
 ) from (Koutsiaris et al. 2007) in capillaries and venules. The red continuous curve is the best fit of the experimental data, and dash curves are the 95% confidence intervals. These curves are presented as reported in (Koutsiaris et al. 2007).
