Figure 5.

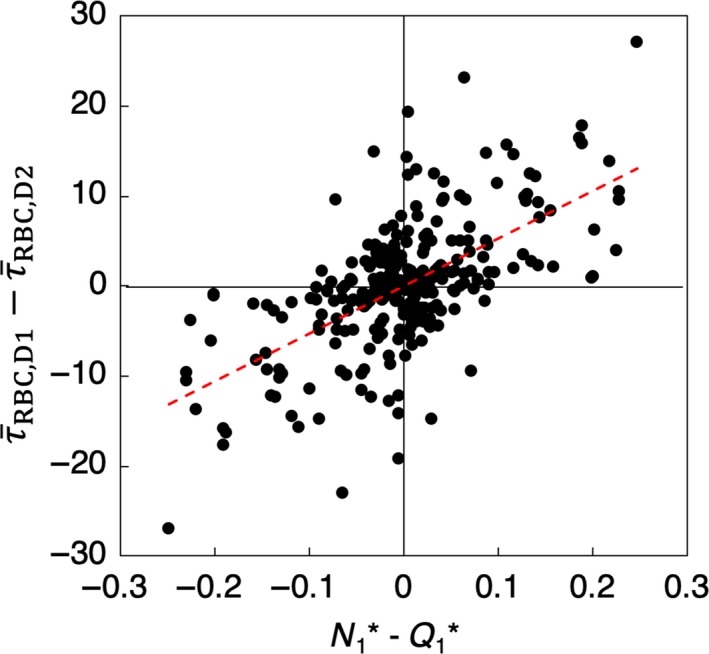
Degree of phase separation (N1*―Q1*) versus the discrepancy in WSS between daughter vessels, (dyne/cm2), for all bifurcations. The red dashed line is a linear regression of the data.

Degree of phase separation (N1*―Q1*) versus the discrepancy in WSS between daughter vessels, (dyne/cm2), for all bifurcations. The red dashed line is a linear regression of the data.