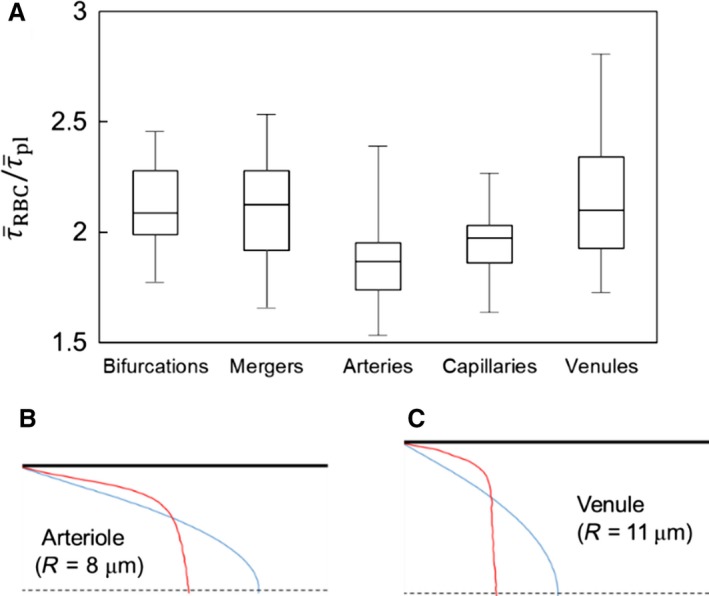
Figure 6.

(A) Influence of RBCs on WSS is quantified by the ratio in different ROIs. (B) & (C): Explanation of greater RBC influence on the venous side. Velocity profiles in the vessels of same order (order 3) are shown for the arterial side (B), and venous side (C). Red: velocity profile from RBC simulation. Blue: profile from plasma‐only simulation.
