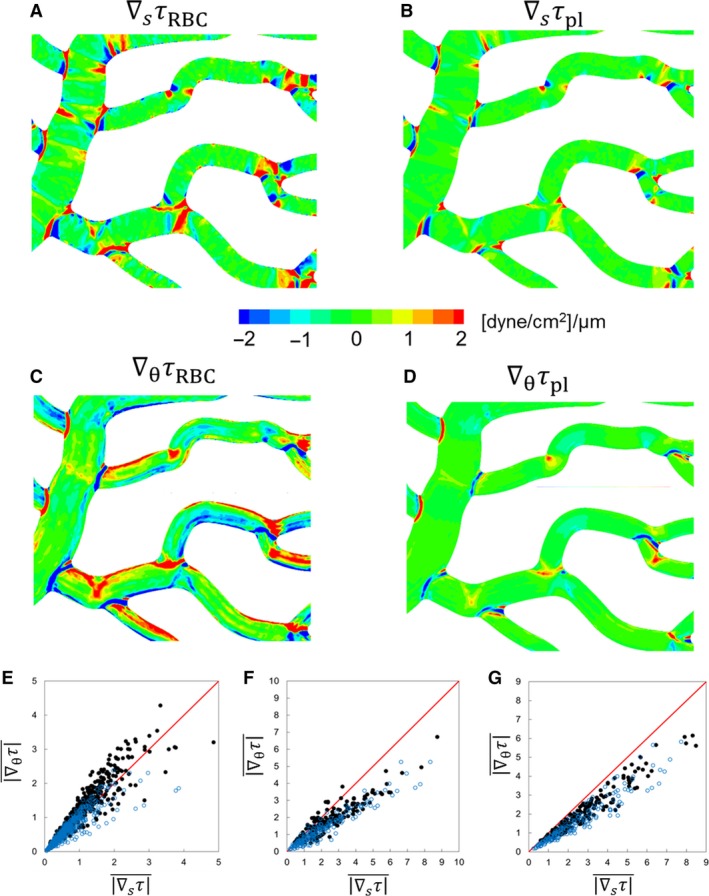
Figure 7.

(A)–(D) 3D distribution of WSSG components in a selected region of a simulated network for comparing the RBC and plasma‐only simulations. (E)–(G) Comparison of axial versus circumferential components of WSSG in different ROIs: vessels (E), bifurcations (F), and convergences (G). Simulations with RBCs ( ); plasma‐only (
 ). Units are in dyne/cm2/μm.
