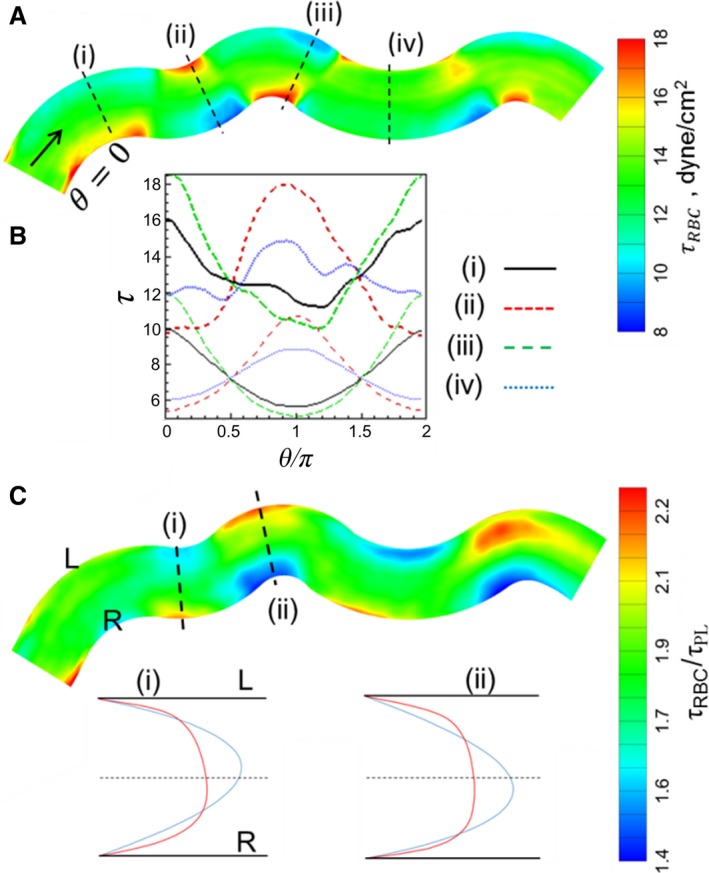
Figure 11.

(A) τ distribution in a representative tortuous vessel selected from a simulated network. (B) Circumferential distribution of τ at four selected locations as shown in (A). Thick curves are for simulations with RBCs, thin curves are without RBCs. (C) Ratio τ/τ pl. Also shown are the predicted velocity profiles at two locations in the vessel for simulations with RBCs (red curve) and without (blue curve). L and R means left and right sides of the vessel looking downstream in the flow direction.
