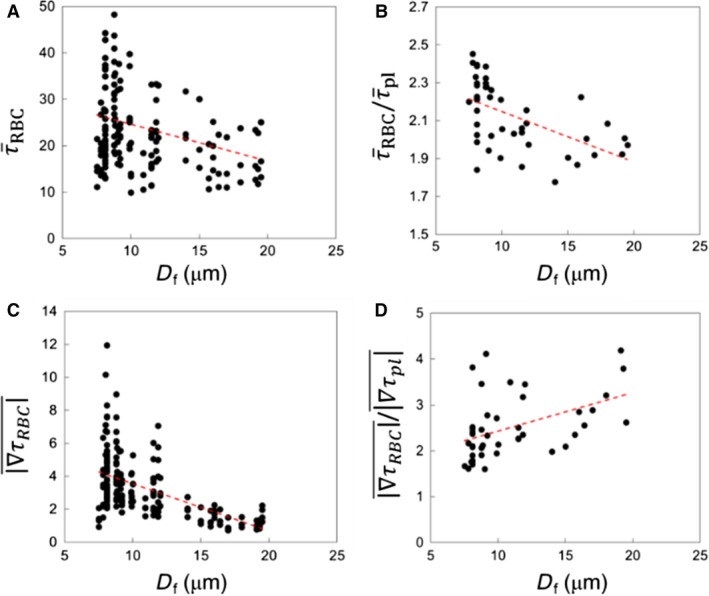
Figure 14.

ROI‐averaged data for bifurcation regions. (A) , (B) , (C) WSSG magnitudes in the presence of RBCs, and (D) ratio of WSSG magnitudes for simulations with and without RBCs, as functions of feeding vessel diameter. Red lines represent a linear regression.
