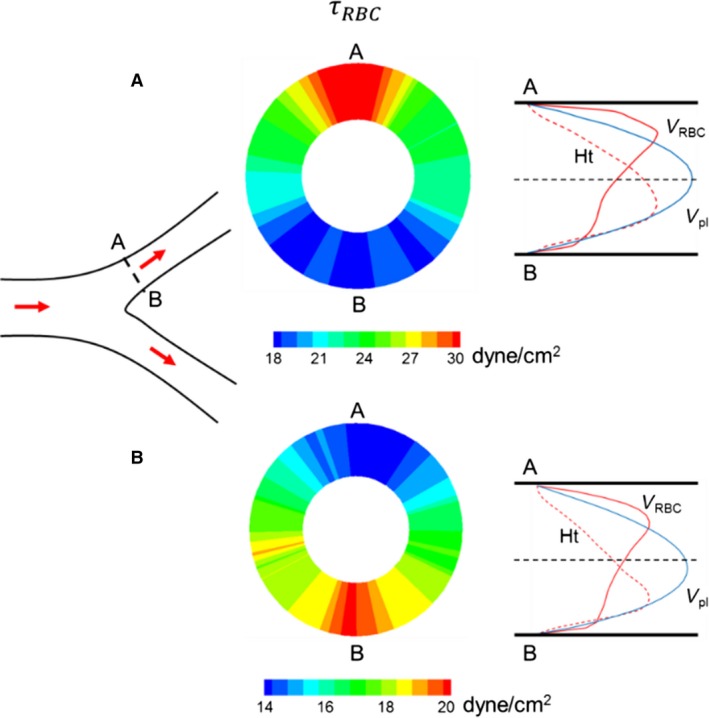
Figure 17.

Relationship between velocity profile skewness and WSS skewness. Left: schematic of a bifurcation showing a cross section (A–B) of interest in one daughter vessel. Middle: Cross‐sectional distribution of τ RBC in the cross section A–B for two example daughter vessels. Right: Velocity profiles in the presence of RBCs (red curve) and without RBCs (blue curve), and hematocrit profile (dashed red curve). For the vessel shown in (A), τ RBC near location A is higher than that near location B, and the velocity profile in the presence of RBCs is skewed toward side A. For the vessel shown in (B), τ RBC near location B is higher than that near A, but the velocity profile in the presence of RBCs is skewed toward side A.
