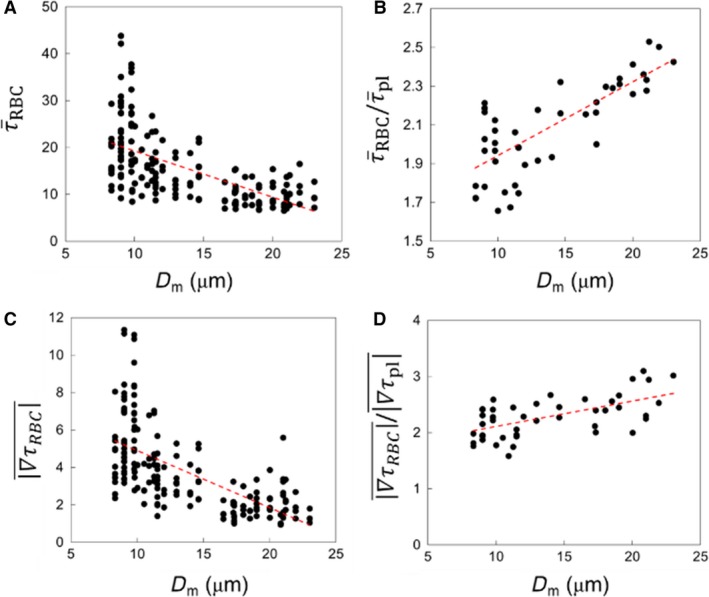
Figure 18.

ROI‐averaged data for venular convergence regions. (A) , (B) , (C) WSSG magnitudes in the presence of RBCs, and (D) ratio of WSSG magnitudes for simulations with and without RBCs, each as functions of collecting vessel diameter(D m). Red lines represent linear regressions.
