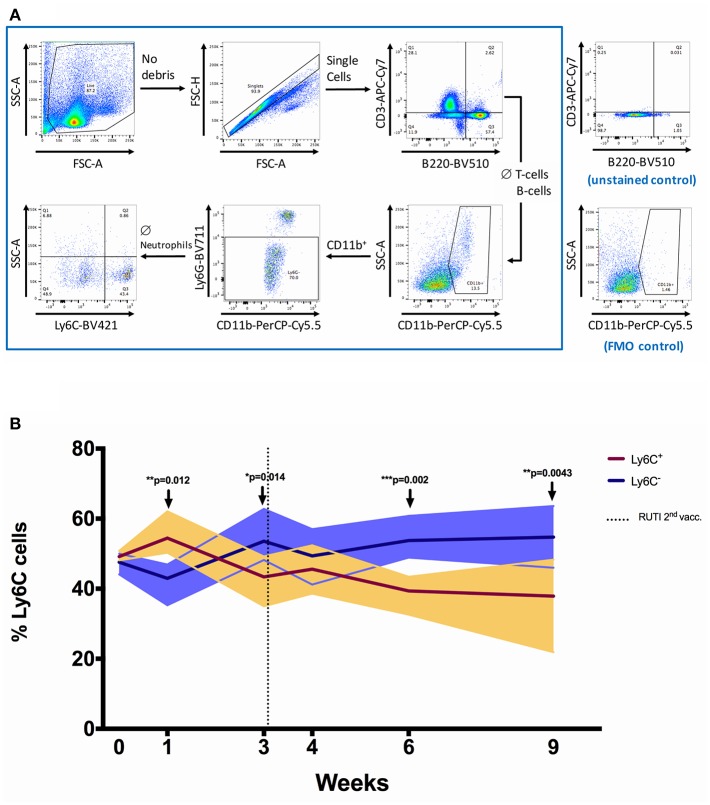
Figure 3.
The shift of Ly6C+ and Ly6C− monocytes/macrophages populations following RUTI vaccination in healthy mice. (A) Gating strategy for flow cytometric analysis. Splenocytes from C57BL/6 mice were fixed, stained and data acquired as described in Materials and Methods. Cell debris was gated out by use of FSC-SSC gate, followed by gating on single cells (FSC-A and FSC-H). A sequential gating strategy was then applied to determine the frequency of T-cells (CD3+), B cells (B220+), monocytes/macrophages (CD11b+ Ly6G− ssclow), and the phenotypes of the monocytes/macrophages (Ly6C+ or Ly6C−) as a percentage of live cells. Plots shown are from a sample of a C57BL/6 spleen. (B) The frequencies of Ly6C+ and Ly6C− monocytes/macrophages were compared at each time point following RUTI vaccination. Dark brown and dark purple lines represent mean percentages of Ly6C+ and Ly6C− monocytes/macrophages, respectively and shading indicates range. Time point 0 represents unvaccinated naïve-control mice sacrificed at week 1. Statistical significance was tested using unpaired t-test, *p < 0.05; **p < 0.01; ***p < 0.005.

