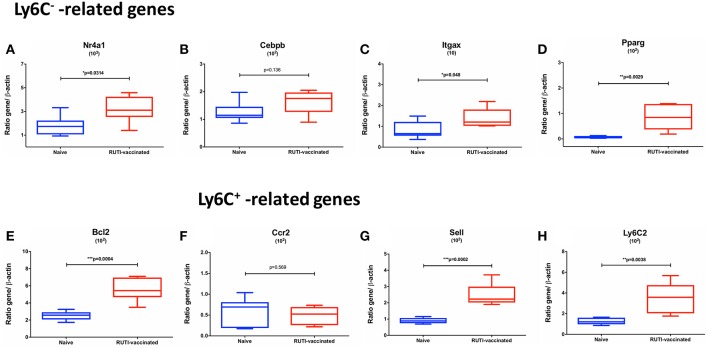
Figure 4.
mRNA expressions of Ly6C− -related (A–E) and Ly6C+ -related genes (F–H) in mice following vaccination with RUTI at week 6 compared to the age-matched naïve control group. Data are expressed as ratio obtained after dividing every value by the expression of β-actin in each sample and multiplying it by a factor (ranging from 101 to 103). The box plots show the minimum and maximum values (ends of the whiskers), the median (band near the middle of the box) and interquartile ranges. Statistical significance was tested using unpaired t-test, *p < 0.05; **p < 0.01; ***p < 0.005.

