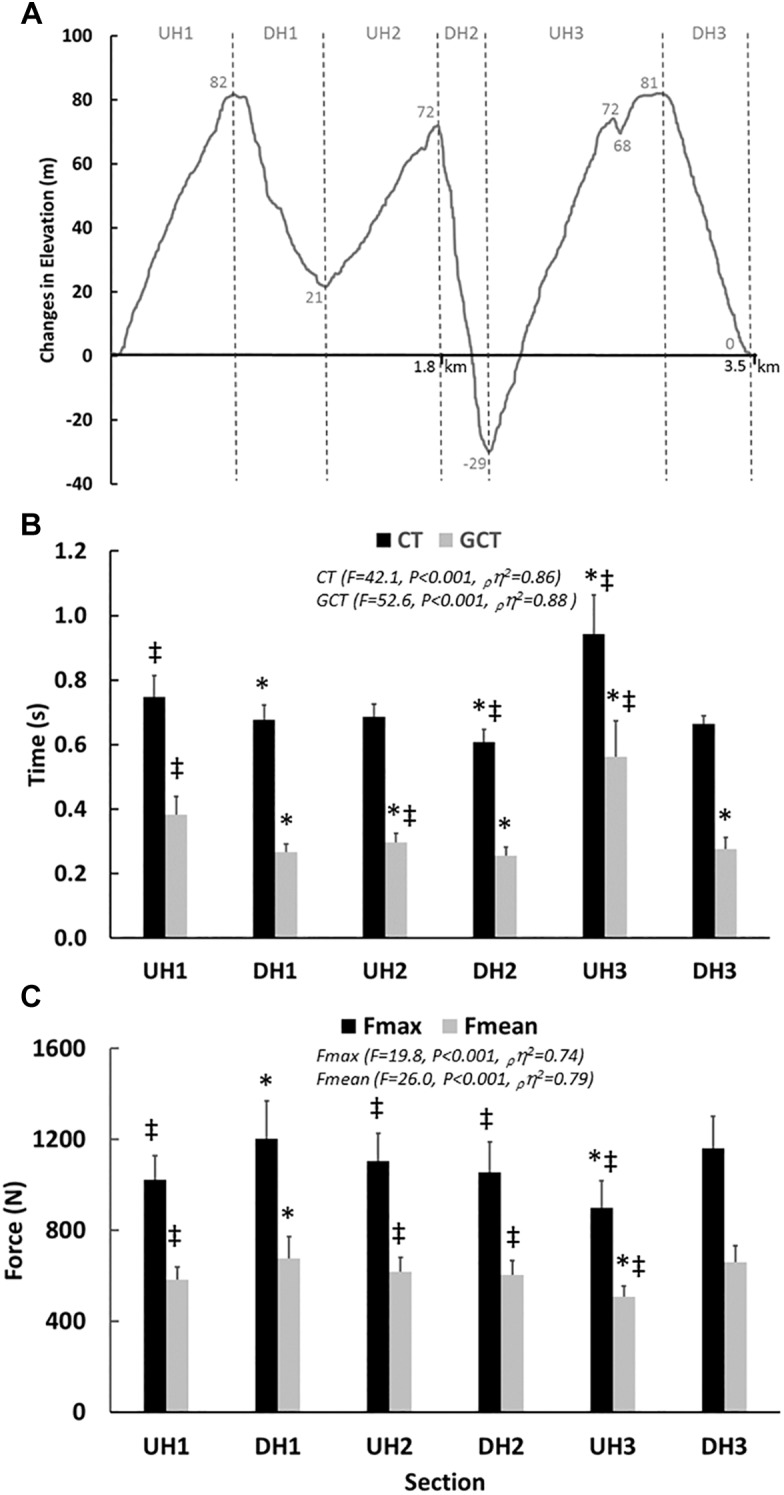
FIGURE 1.

(A) Schematic illustration of the trail course and the specific uphill (UH) and downhill (DH) sections. (B) Cycle time (CT) and Ground Contact Time (GCT) expressed in s, at various sections of the course illustrated through black and gray bars, respectively. (C) Foot forces (N) at various sections of the course expressed as force max (Fmax) and mean (Fmean) illustrated using black and gray bars, respectively. The F-, P-values, effect size (pη2) and power values obtained with the one way ANOVA (time sections) are presented. ‡P < 0.05 in comparison to DH1 and ∗P < 0.05 in comparison to UH1. The values given are mean ± SD.
