
Figure 3.
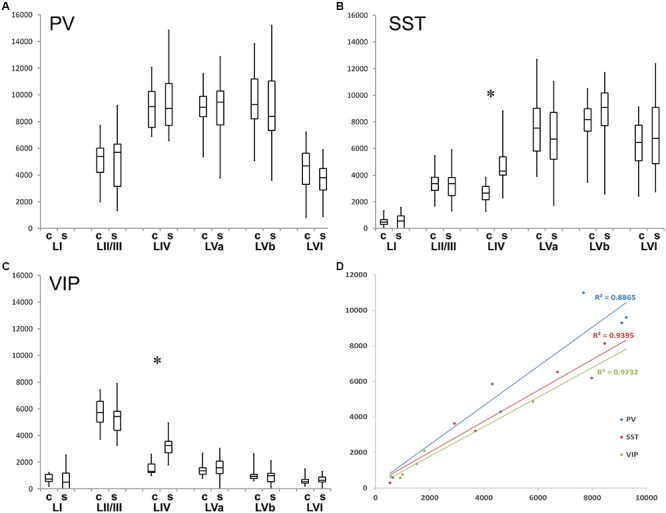
Quantification of layer- and column-related distribution of GABAergic interneurons. Box and whisker plot of laminar density of (A) PV+, (B) SST+, and (C) VIP interneurons. Note the statistically significant difference between barrel column (C)- and septum (S)-associated compartments for VIP+ and SST+ cells in layer IV. Significant laminar distribution differences were not denoted because of figure transparency, details were explained above. The graphs also show that all of the studied interneurons completely (PV+) or largely (SST+, VIP+) avoid LI. (D) Diagram shows the cell densities of coronal versus tangential sections. Correlation coefficients (R) are close to 1, so the numbers are highly correlated to each other (RPV. = 0.925; R SST = 0.940; R V IP = 0.973).