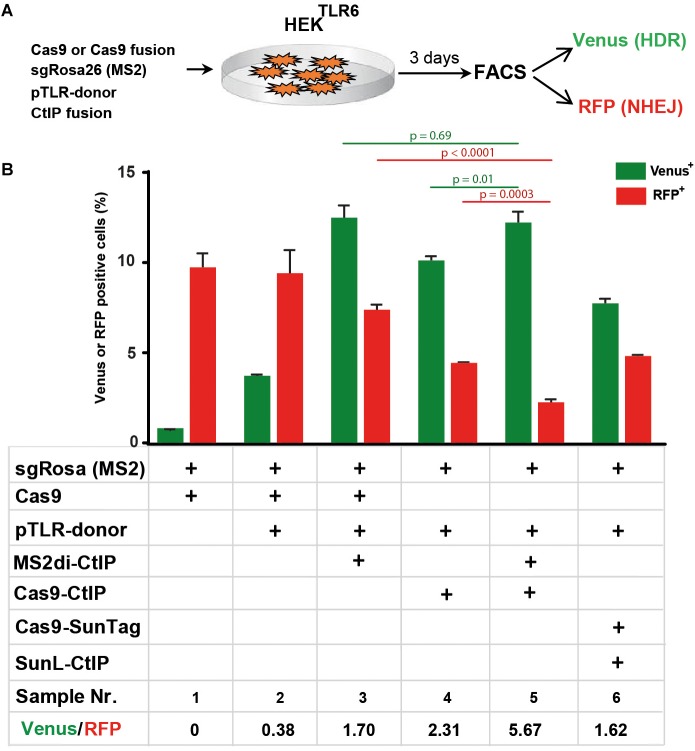
FIGURE 6.
Comparison of Cas9-CtIP, MS2di-CtIP, and SunL-CtIP fusion proteins. (A) Expression vectors for Cas9, Cas9-CtIP, or Cas9-SunTag, sgRosa26(MS2), pTLR-donor, and MS2di-CtIP or SunL-CtIP were cotransfected into HEKTLR6 cells and the frequency of Venus+ cells (green columns) and RFP+ cells (red columns), indicating DSB repair by HDR or NHEJ, was determined by FACS analysis 72 h after transfection. (B) Transfection results are shown as bar graphs representing mean values ± standard deviation of triplicate samples. Plasmids selected (+) for individual transfections are indicated as in the table below. Mean values were used to calculate the ratio of Venus+ to RFP+ cells and p-values (T-test) to determine the significance in levels of Venus+ or RFP+ cells between samples 5 and 3 or 4 (top horizontal lines). Two independent replicates of the assay were performed that confirmed the results.

