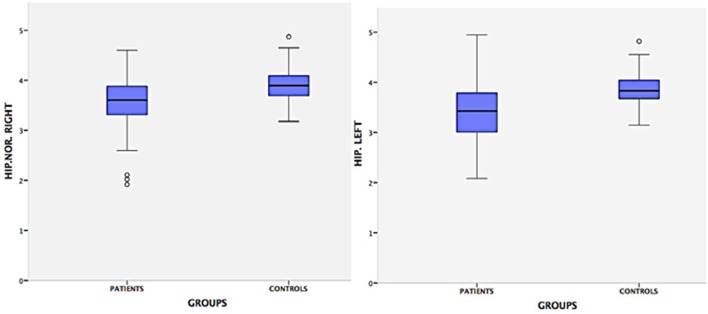
Figure 1.
Hippocampal volumes of patients and controls. This graph demonstrates that there is a difference in the size of the hippocampus of NC patients compared to healthy controls. The Mann-Whitney test showed a significative difference between the hippocampal volume of patients and controls (p = 0.001). Evidence of a possible relationship between NC and hippocampal atrophy. HIP.NOR.RIGHT: hippocampus normalized right; HIP.LEFT: hippocampus left. Patient–Hip. Right, Mean = 3.50 cm; SD = 0.57; Range = 2.68; Hip. Left, Mean = 3.36 cm; SD = 0.60; Range = 2.88; Controls–Hip. Right, Mean = 3.92 cm, SD = 0.34, Range = 1.92; Hip. Left, Mean = 3.84 cm, SD = 0.31; Range = 1.89.

