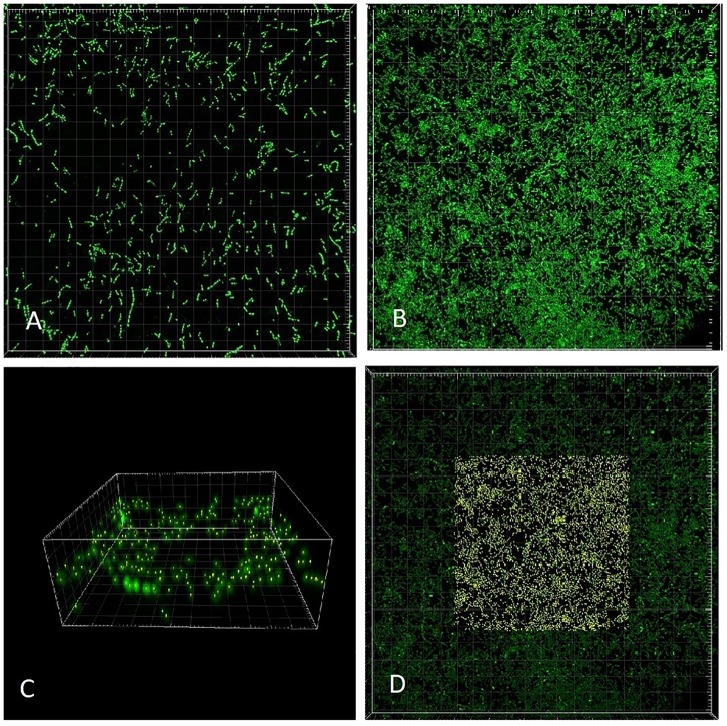
FIGURE 3.
CLSM (Syto 9) 3-dimensional rendering of Enterococcus faecalis biofilms at two different dilution rates (D). (A) D = 0.09 h-1 and (B–D) D = 0.81 h-1. Cells marked with Imaris Point Viewer (C) entire image and (D) central 25% of image volume (same CLSM file as B). Side of the square base of image (A,B,D) 203.2 μm and side of the square base of image (C) 25.4 μm.

