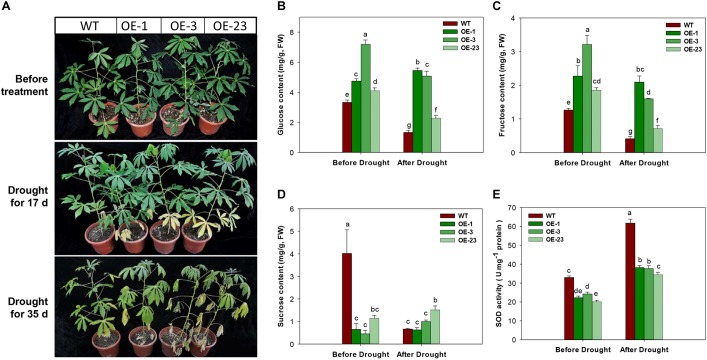
FIGURE 10.
Phenotypical and physiological performance of wild-type (WT) and MeCWINV3-overexpressed (OE) cassava plants under drought treatment. (A) Changes in plant phenotype under drought treatment for 17 and 35 days. (B–D) Contents of glucose (B), fructose (C), and sucrose (D) in mature leaves. (E) Total SOD activity in mature leaves. Different letters indicate significant differences (one-way ANOVA, p < 0.05).

