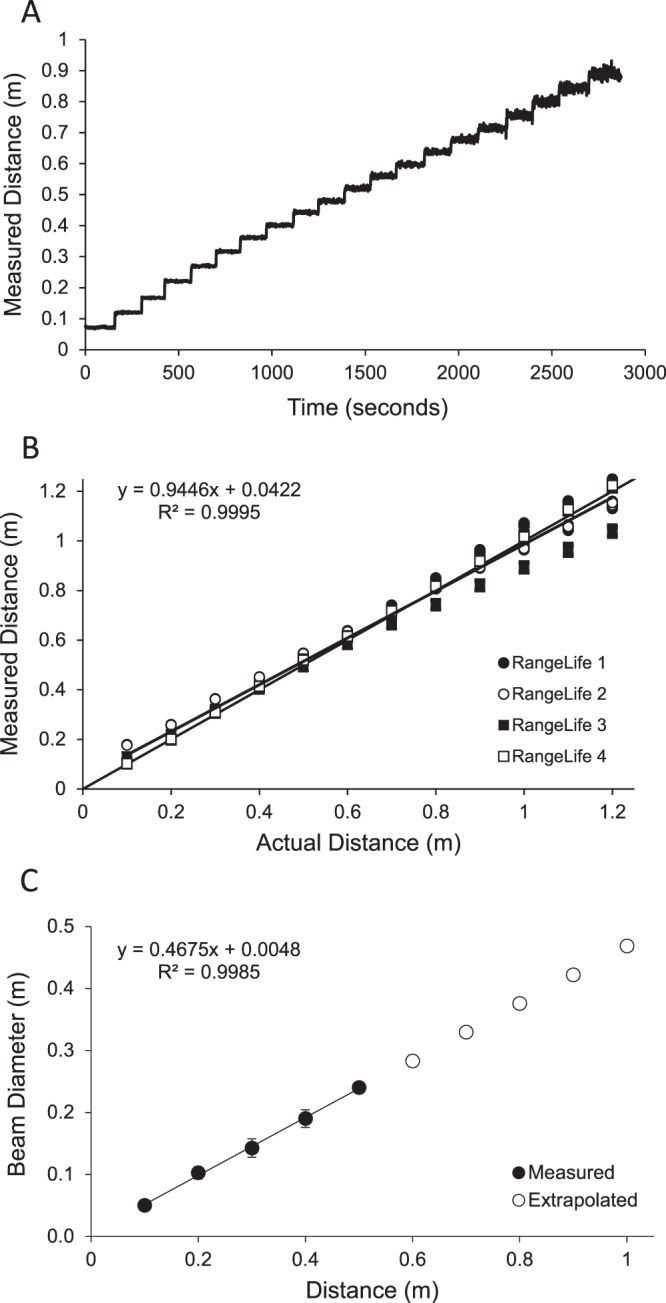
Figure 1.

(A) Representative example of raw data from one RangeLife device as it is moved away from a wall from 0.05 to 1.0 m in 0.05 m steps approximately every 150 seconds. (B) Linear regression (solid line) showing the relationship between actual distances versus device-measured distances for each of the four devices. Dashed line represents the 1:1 line. (C) Infrared beam diameter with distance from a surface. Solid symbols are measured values and open symbols are extrapolated from the linear regression (solid line). Error bars represent standard deviation for the four devices.
