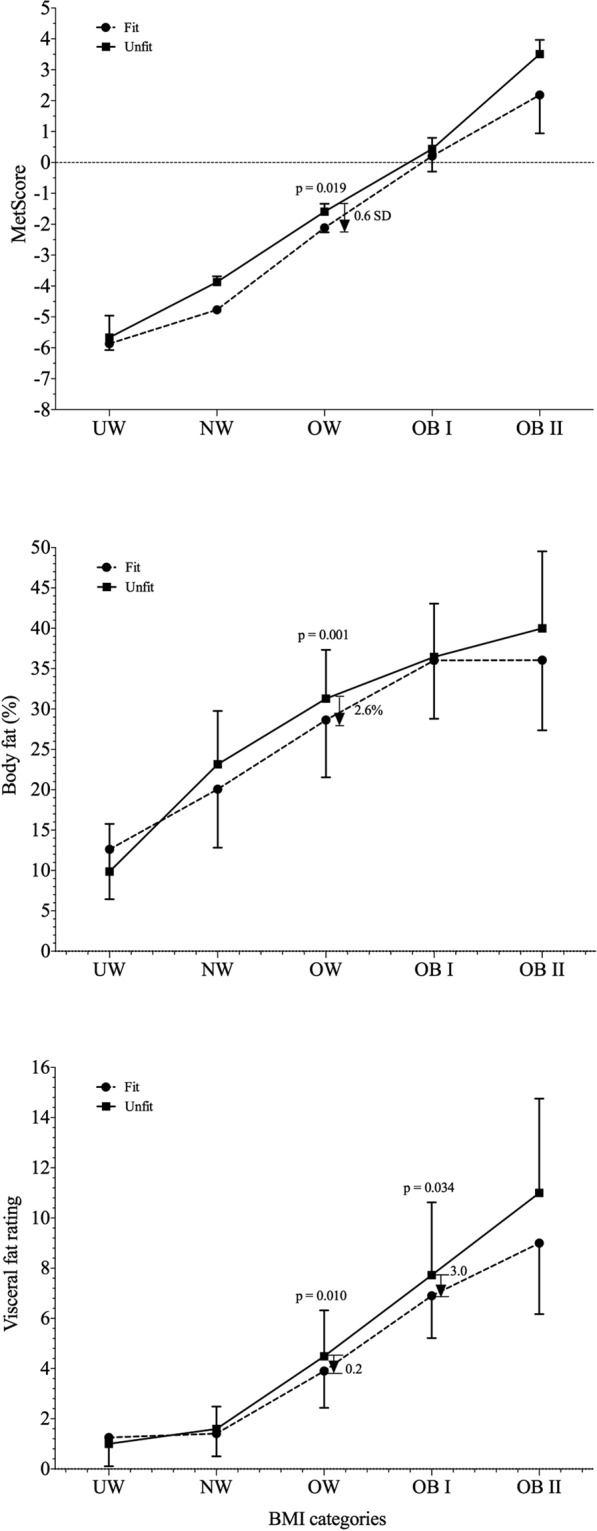
Figure 2.

MetScore and fatness markers across BMI categories by fit and unfit individuals. The dashed line represents a value of zero for the scores, and a higher score represents a greater cardiometabolic risk. The arrow shows the reduction in the MetScore (expressed in the number of SDs), body fat (%) or visceral fat rating for the fit collegiate students compared with the unfit collegiate students in the OW or OB II group. UW, underweight; NW, normal-weight; OW, overweight; OB I, moderate obesity; and OB II, severe obesity.
