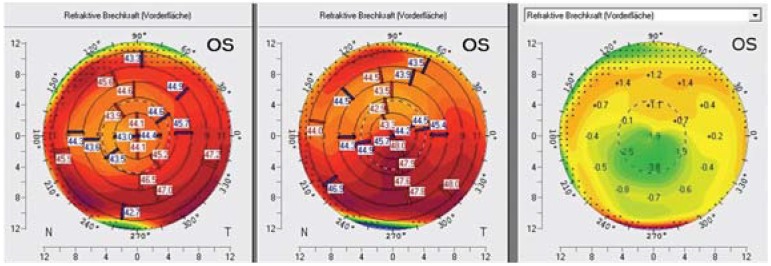
Figure 3.
Course following cross-linking. Tomography at the time of cross-linking (center) and 3 months following cross-linking (left). The anterior corneal surface exhibits virtually normal refractive power (left) with a decrease of up to 3.8 dpt in the difference map of the two measurements (right, central green area).
Figure: Archives of the Eye Center at the University of Freiburg Medical Center, Germany

