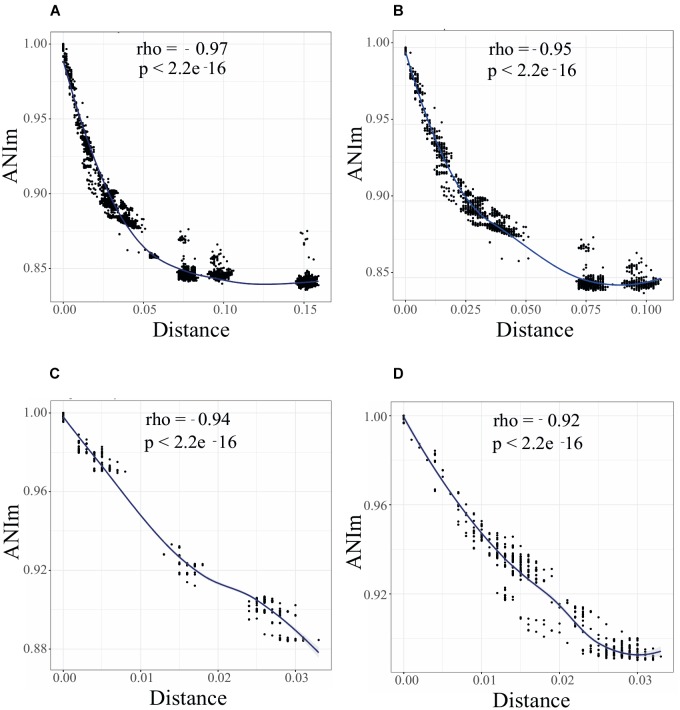
FIGURE 2.
A continuum of genomic diversity and genome clusters in Rhizobium and Sinorhizobium. Spearman correlation test between ANIm and genetic distance between genome pairs of Rhizobium and Sinorhizobium strains: (A) 102 Rhizobium and Sinorhizobium strains, phylogenomic clades rC-I to rC-VI; (B) 88 Rhizobium strains of clades rC-I to rC-IV; (C) 35 strains of clade rC-I; (D) 38 strains of clade rC-II. Black dots indicate the Spearman correlations between pair of strains; local regression line in blue. ρ (R or Rho) and P-values are indicated in the inset.

