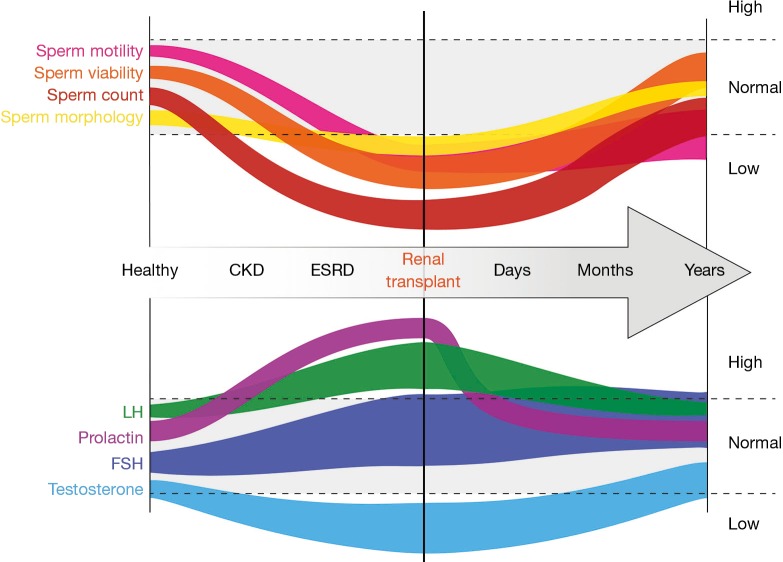
Figure 1.
Graphical representation of hormonal and seminal parameter changes with end stage renal disease and renal transplantation. Note that the width of the graphical elements represents the variability reported in the literature for each respective variable. The gray areas and dotted lines represent the range of values seen in healthy fertile males.

