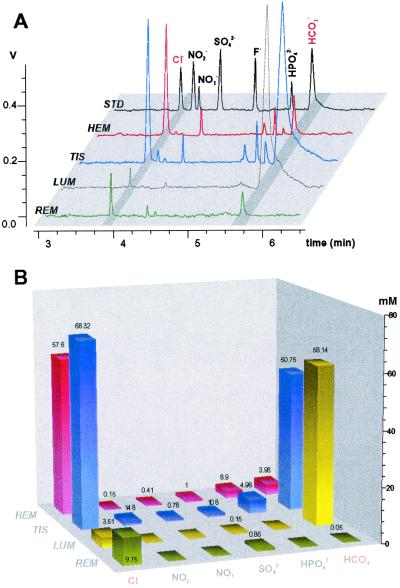
Figure 2.
CZE analyses of anions in mosquito body samples with outlet conductivity detector. (A) Orthogonal overlay of typical electropherograms from subset of biological samples. REM, rearing media; LUM, ectoperitrophic fluid (lumen) sample from the anterior midgut area; TIS, anterior midgut tissue sample; HEM, hemolymph; STD, 2-ppm mixture of anion standards. z axis signal from conductivity detector, V (scale setting of 1 V corresponds to 100 μS). (B) The absolute values of ion concentrations were estimated by using peak areas and slope values from standard solutions. The z axis is the estimated ion concentrations in undiluted samples in mM. Numbers above bars are mean values of the determined concentrations (n ≥ 3, for all values shown).

