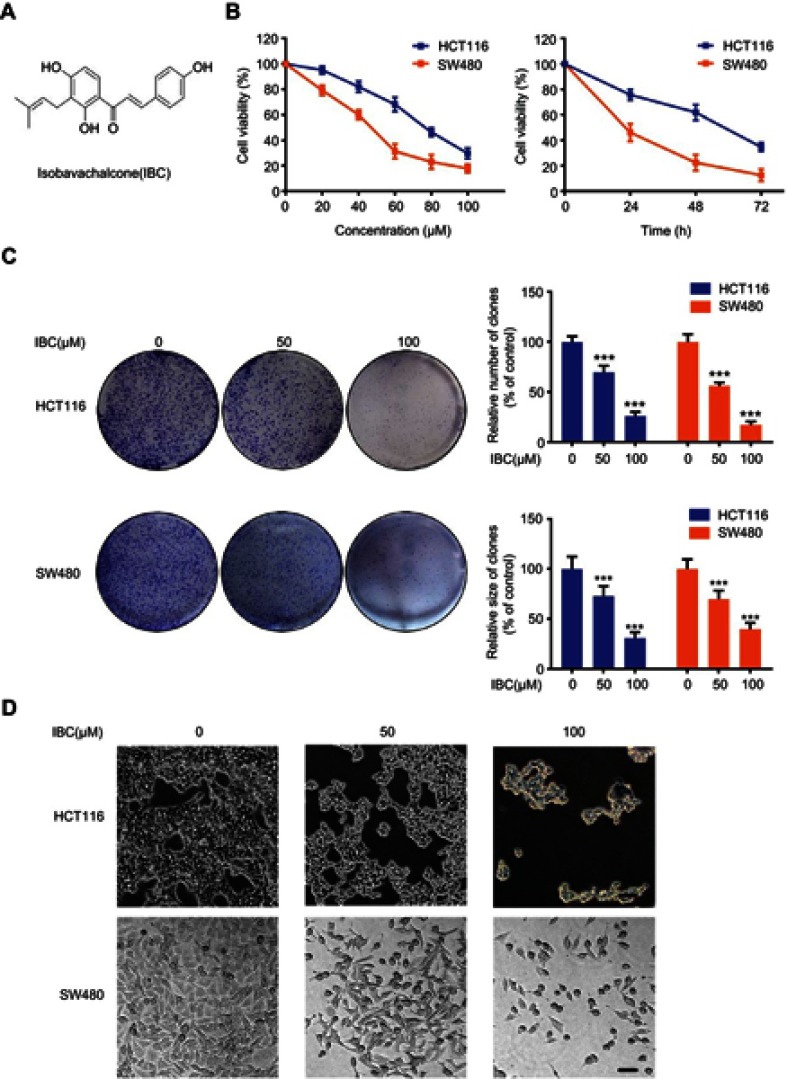
Figure 1.
IBC inhibited proliferation and colony formation of human CRC cells. (A) Chemical structure of IBC. (B) HCT116 and SW480 cells were treated with different concentrations of IBC (0–100 µmol/L) for 24, 48, and 72 hrs, and cell viability was measured using the CCK-8 assay. (C) HCT116 and SW480 cells were incubated with different concentrations of IBC (0, 50, and 100 µM) for 24 hrs and assayed for colony formation. The upper panel shows representative images of colony formation after treatment with IBC for 24 hrs and results of quantitative analyses of colony number. The lower panel shows the results of quantitative analyses of colony size. (D) Morphological changes of HCT116 and SW480 cells were observed using contrast microscopy after treatment with the indicated concentration of IBC for 24 hrs. Scale bars =20 µm. The results shown in panels B and D are represented as mean ± SD of three independent experiments. ***p<0.001 compared with control group.

