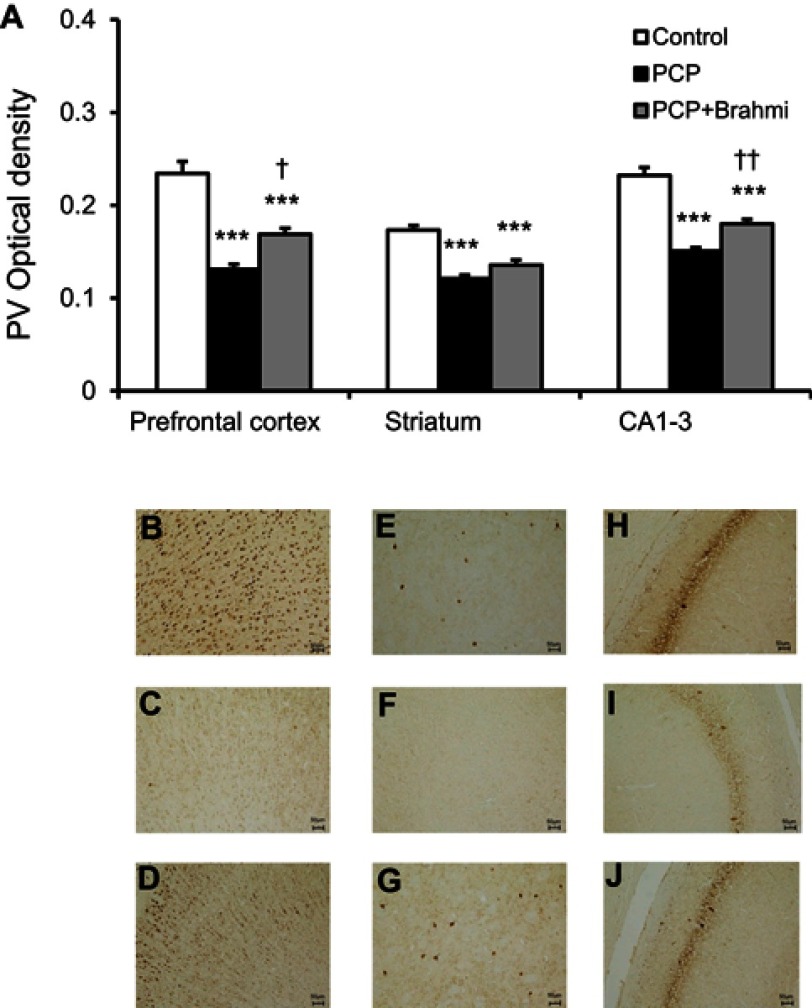
Figure 2.
(A) PV optical density in the prefrontal cortex, striatum, and CA1–3 of control, PCP, and PCP+Brahmi groups (n=9/group). Data are mean±SEM. ***P<0.001 vs control, †P<0.05, ††P<0.01 vs PCP. (B) Photomicrographs showing PV immunoreactivity in one area of interest (500 μm×500 μm) in the prefrontal cortex of control, (C) PCP administration, and (D) PCP+Brahmi groups, (E) in striatum of control, (F) PCP administration, and (G) PCP+Brahmi groups, (H) in CA1–3 of control, (I) PCP administration, and (J) PCP+Brahmi groups. (20× magnification, scale bar: 50 μm.) PV immunoreactivity of each rat was measured in five areas of interest, and the distance between each area of interest was 500 μm.
Abbreviations: PCP, phencyclidine; PV, parvalbumin.

