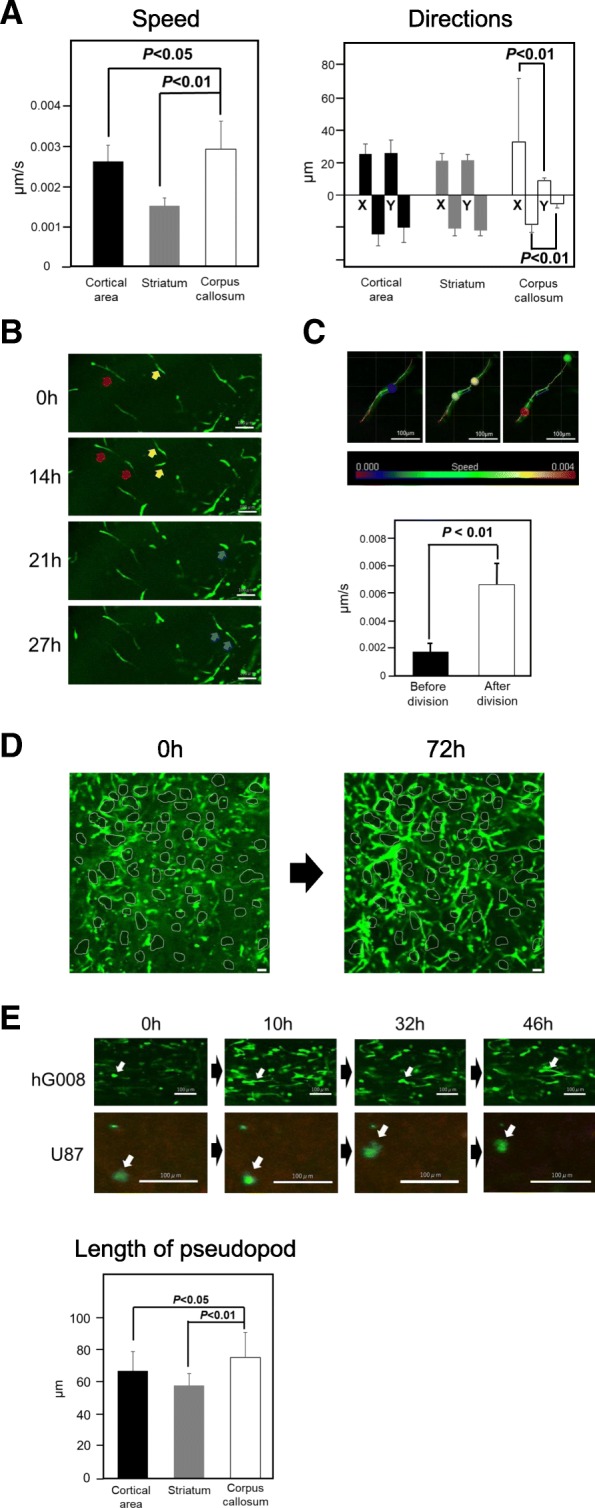
Fig. 3.

Migration of hG008 cells in different brain areas of slice culture. a Speed and direction of hG008 cell migration in the cortical area, striatum, and corpus callosum were analyzed using Imaris software during the period from 48 h to 96 h of culture. Data represent the mean ± SEM (n = 56). b Snapshot images of hG008 cell division in the striatum and cortical area of contralateral side at the indicated time points are shown. Arrows (red, yellow, and blue) indicate dividing cells. c Migration speed was calculated for 12 h before and after cell division using Imaris software. Data represent the mean ± SEM (n = 12). Snapshot images of cell division are shown. Colored scale bar represents cell migration speed (μm/second). d Migration of hG008 cells along the vertically passing axon bundles in the striatum. Snapshot images after 0 h and 72 h of culture are shown. Areas enclosed by white lines depict axon bundles. Scale bar, 100 μm. e The length of pseudopod of hG008 cells was quantified using ImageJ software during the period from 48 h to 96 h of culture. Data represent the mean ± SEM (n = 18). Snapshot images of hG008 cells and U87 cells in the corpus callosum at the indicated time points are shown. Scale bar, 100 μm
