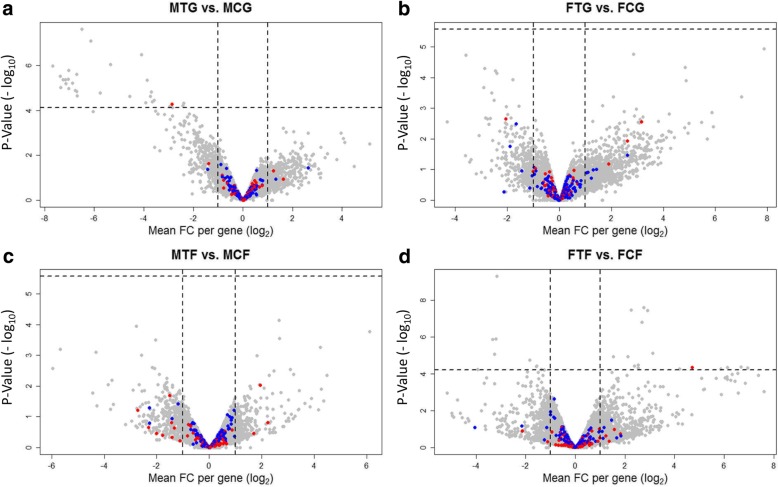
Fig. 2.
Volcano plots illustrate significantly differentially expressed genes (DEGs) in treatment versus control within males and females in the gonad and caudal fin. a, male treatment gonad versus male control gonad: MTG vs. MCG; b, female treatment gonad versus female control gonad: FTG vs. FCG; c, male treatment fin versus male control fin: MTF vs. MCF and d, female treatment fin versus female control fin: FTF vs. FCF. Each dot in the plot represents a gene with its corresponding log2-fold change (FC) on the x-axis and p-value (−log10) on the y-axis. Red colour dots show selected candidate sex determination genes and blue colour dots represent selected candidate colour pattern genes. The horizontal line indicates the significance threshold (false discovery rate; FDR < 0.05), while the vertical line segregates genes with log2FC > 1

