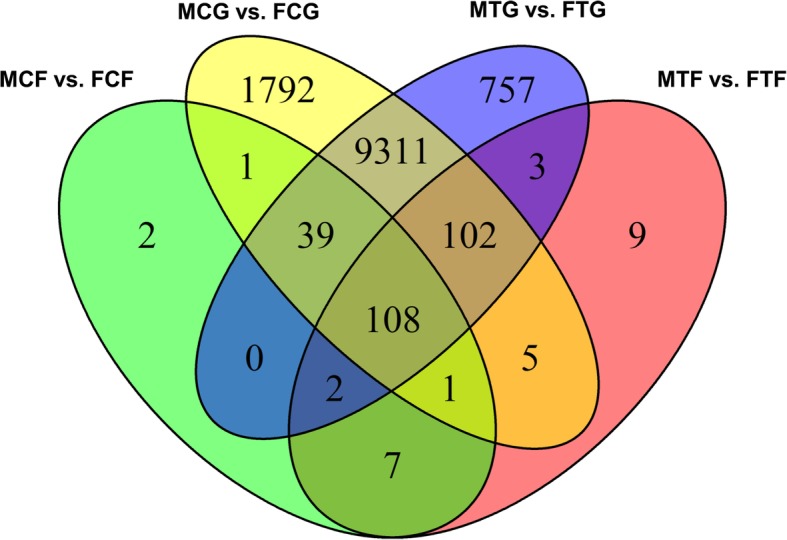
Fig. 6.

Venn diagram shows overlapping of significantly differentially expressed genes (DEGs) (false discovery rate; FDR < 0.005) using multiple comparisons with fold-changes (FC > 2): male control gonad versus female control gonad (MCG vs. FCG, yellow), male treatment gonad versus female treatment gonad (MTG vs. FTG, blue), male control fin versus female control fin (MCF vs. FCF, green), and male treatment fin versus female treatment fin (MTF vs. FTF, red)
