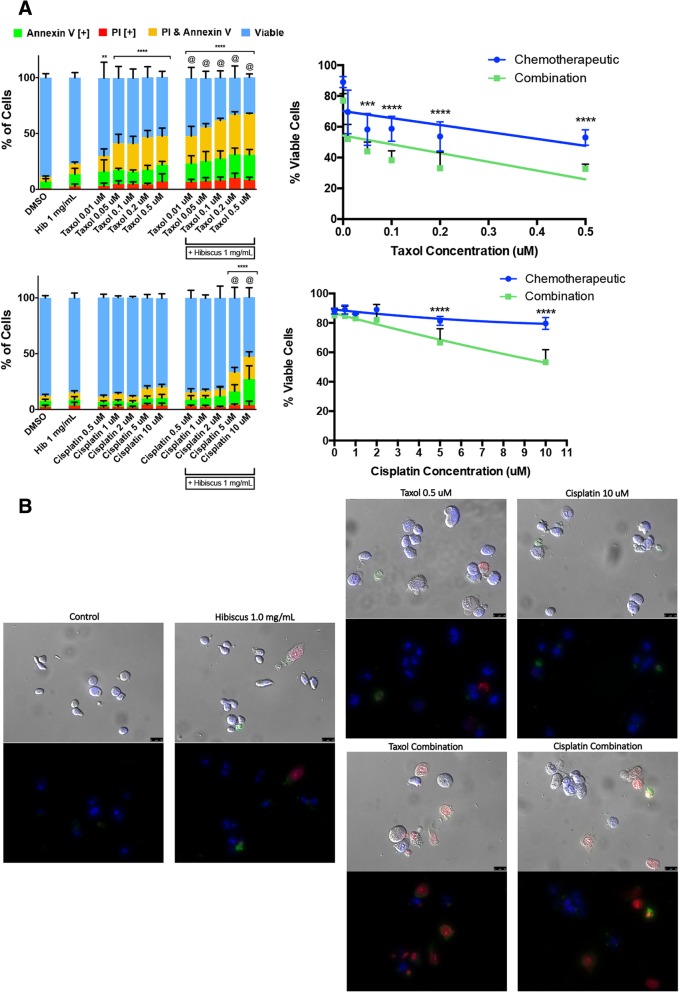
Fig. 2.
Hibiscus extracts indicate synergy with chemotherapeutics when treated in combination on triple-negative breast cancer cells. a MDA-MB-231 cells were treated with chemotherapeutics taxol (top panel) and cisplatin (bottom panel) individually and in combination with 1 mg/mL HE and assessed at 48 h. Results were obtained using image-based cytometry to assess the percentage of cells positive with fluorescence associated with Annexin V (green), PI (red), both (yellow), or negative for both Annexin V and PI (blue). Values are expressed as a mean ± SD from three independent experiments. The percentage of viable cells were graphed for both individual chemotherapeutic and combination chemotherapeutic treatments (graphs on right). b Fluorescence microscopy images of individual and hibiscus combination chemotherapeutic treatments on MDA-MB-231 cells were taken at 48 h.. Top panels: Brightfield and fluorescent merged images at 400x magnification. Bottom: Fluorescent images stained with Annexin V (green), PI (red), and Hoechst (blue) at 400× magnification. Scale bar is 50 μm. Images are representative of three independent experiments. Statistical calculations were performed using Two-Way ANOVA multiple comparison. *p < 0.05 vs. Control, **p < 0.01 vs. Control, ****p < 0.0001 vs. Control, @p < 0.05 vs. Individual Chemotherapy Treatment

