Fig. 5.

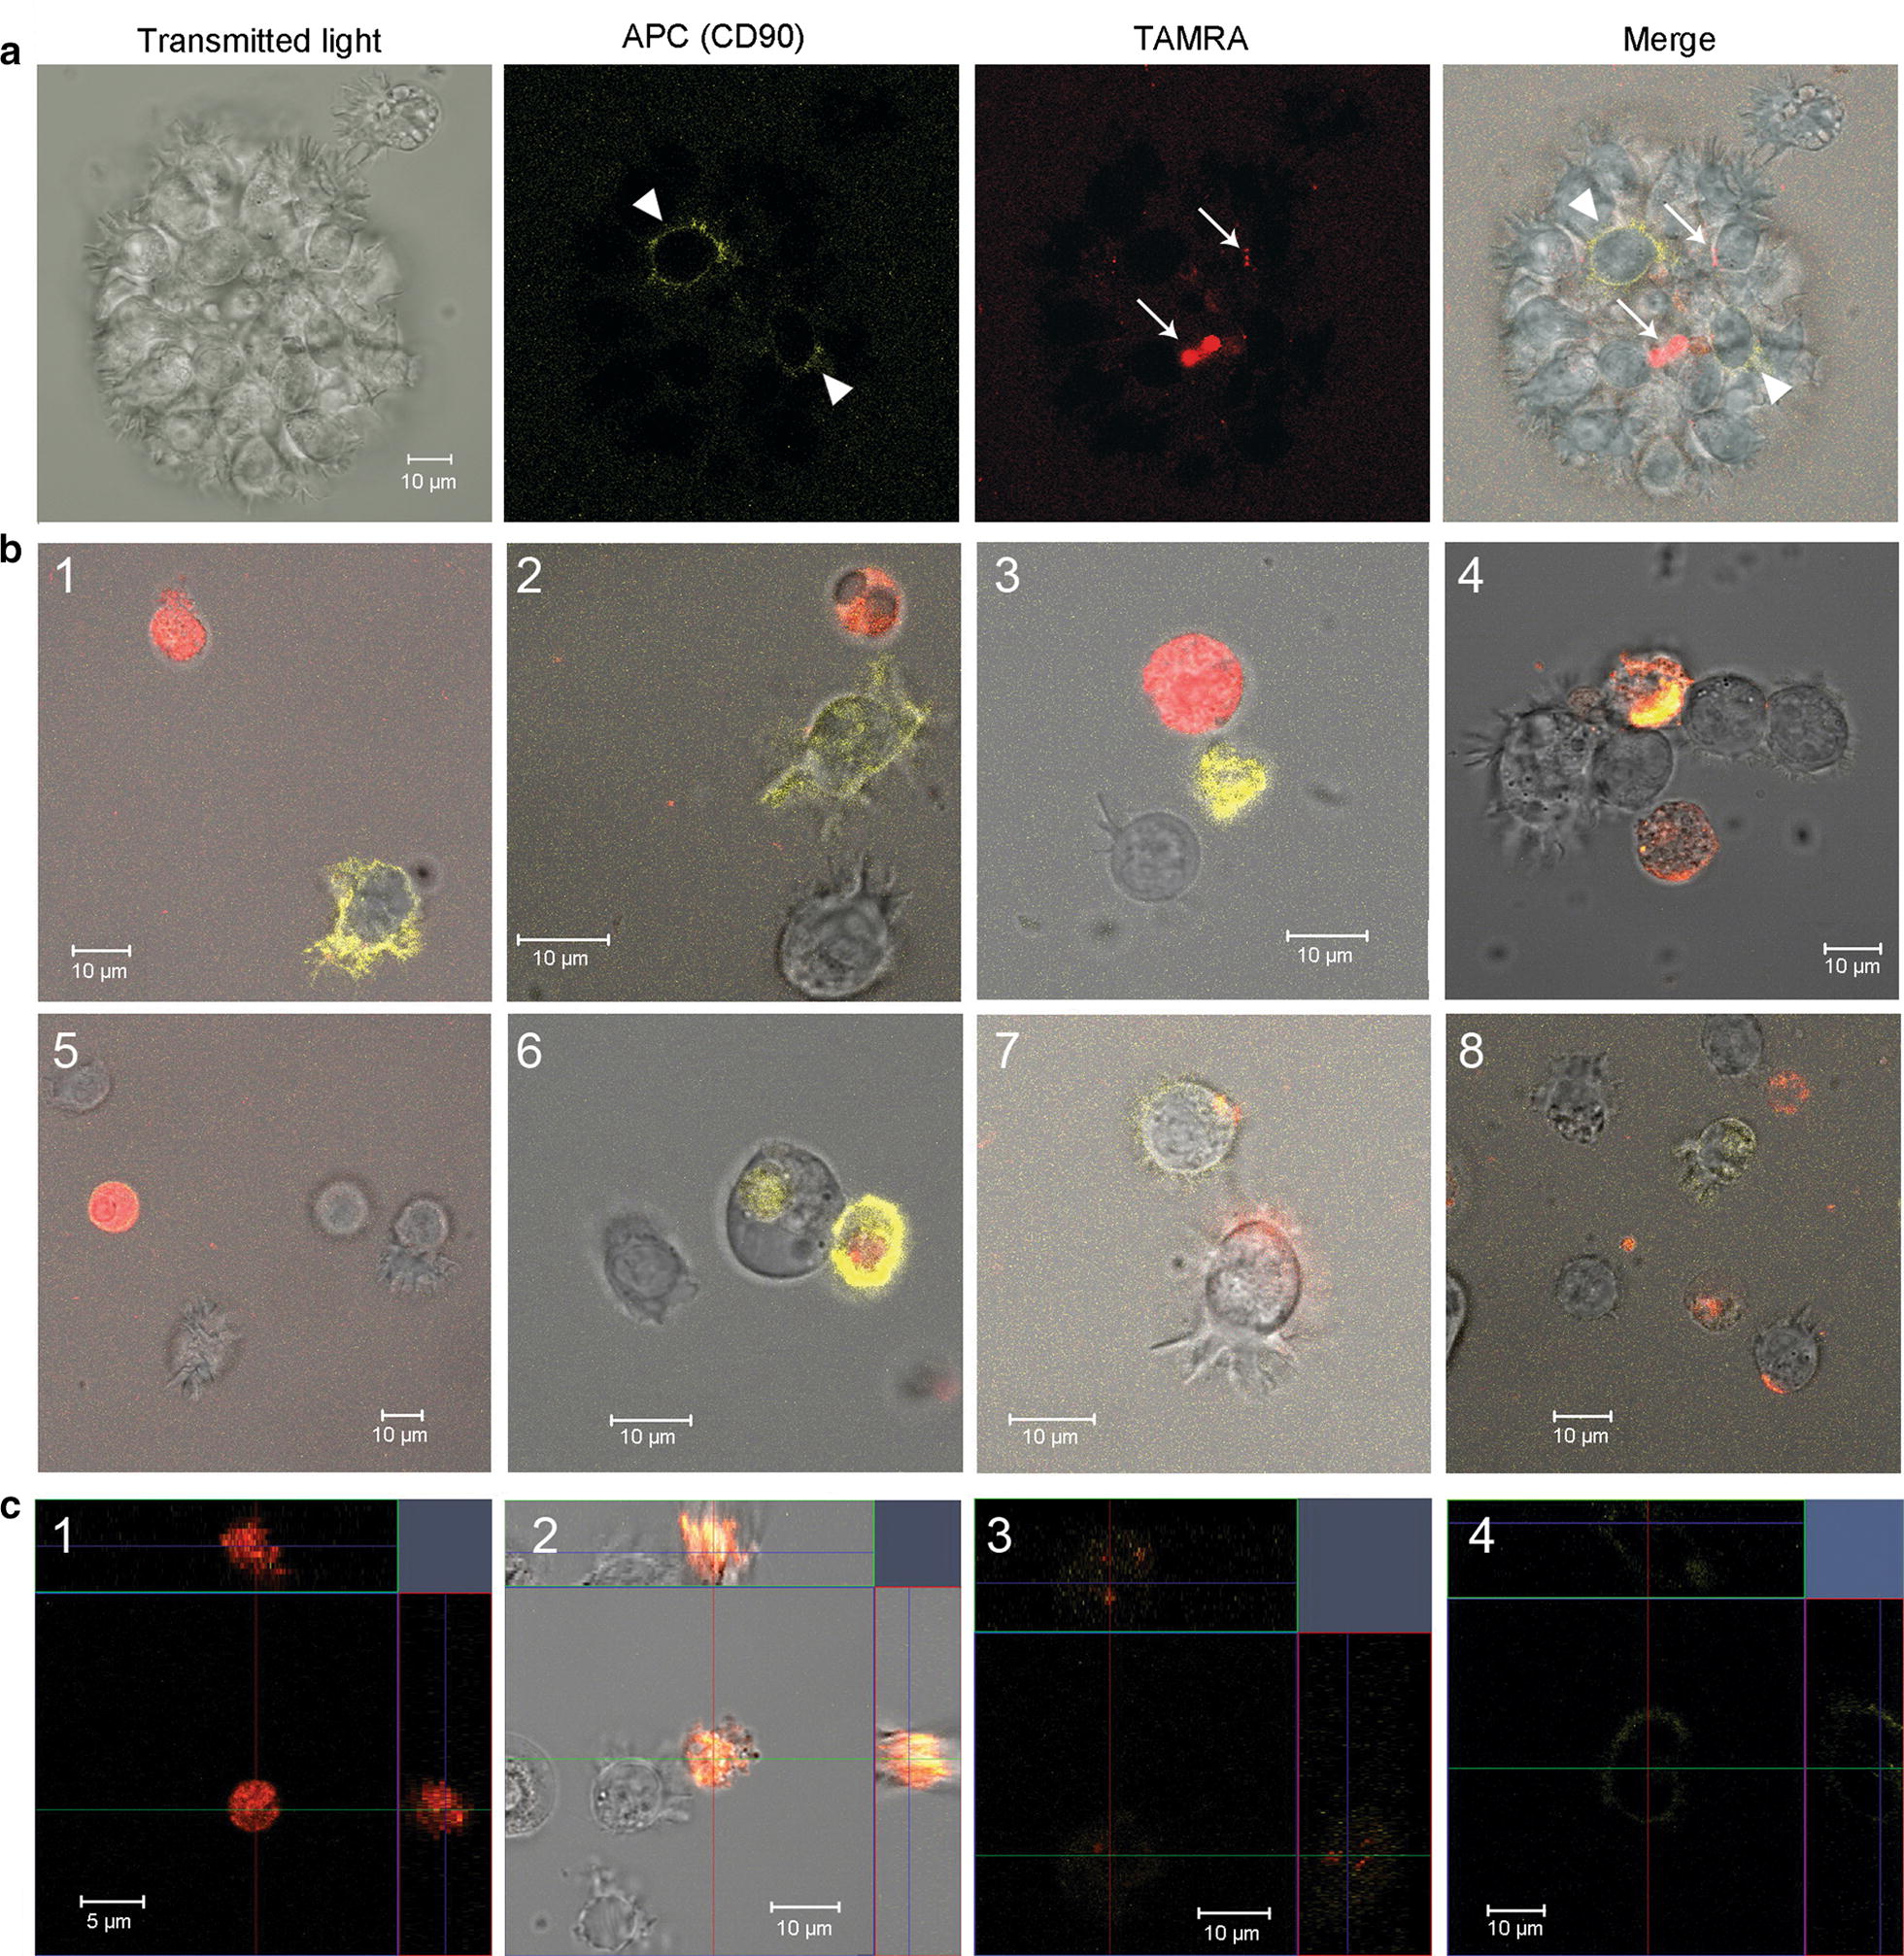
Dual analysis of cells with regard to their ability both to bind antibodies to the surface marker CD90 and to internalize TAMRA-DNA in ex vivo culture. a Spheres. Arrowheads indicate CD90+ cells, arrows—TAMRA+ cells. b Individual cells. c Orthogonal projections of cells showing 3d distribution of the signal in different cells
