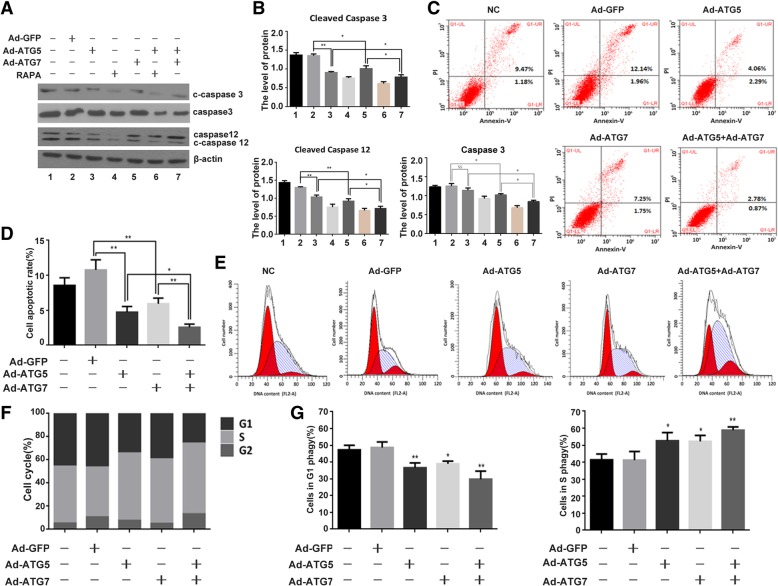
Fig. 5.
ATG5 and ATG7 inhibited apoptosis and promoted chondrocyte proliferation. a The expression of caspase3, cleaved caspase3 and cleaved caspase12 protein were analysed by western blotting after infected with Ad-GFP, Ad-ATG5, Ad-ATG7 and Ad-ATG5 + Ad-ATG7 in C28I2 cells. b Qualitative analysis of caspase3, cleaved caspase3 and cleaved caspase12. The values were normalized to β-actin. Rapamycin (25 μM) used as a positive control. c Flow cytometry (FCM) analysis with Annexin V –PI staining was performed to evaluate the percentage of apoptotic cells in C28I2 cells after infected with Ad-GFP, Ad-ATG5, Ad-ATG7 and Ad-ATG5 + Ad-ATG7. The percentage of apoptotic cells in the Ad-ATG5 + Ad-ATG7 group was significantly reduced compared with that of the Ad-GFP, the Ad-ATG5 and the Ad-ATG7 group. d Analysis on cell apoptosis results. Data are mean ± SD for relative apoptosis normalized to control cells for three independent experiments. Columns mean of five separate experiments. Representative images from flow cytometry analysis are shown. e Flow cytometry images with propidium iodide (PI) staining and analysis of cell cycle distribution with flow cytometry. Experiments were repeated three times, samples were analyzed by Student’s t test and statistical significance with P < 0.05. Representative images were shown. Experiments were repeated three times. f Percentage of cells at each phase in C28I2 cells after infected with Ad-GFP, Ad-ATG5, Ad-ATG7 and Ad-ATG5 + Ad-ATG7. g Percentage of S phase and G1 phase in C28I2 cells infected with Ad-ATG5, Ad-ATG7, Ad-ATG5 + Ad-ATG7.*P < 0.05, **P < 0.01 compared with the controls. Values are means ± SD n = 3). (1:NC, 2:Ad-GFP, 3:Ad-ATG5, 4:RAPA, 5:Ad-ATG7, 6:Ad-ATG5+ RAPA, 7:Ad-ATG5 + Ad-ATG7)

