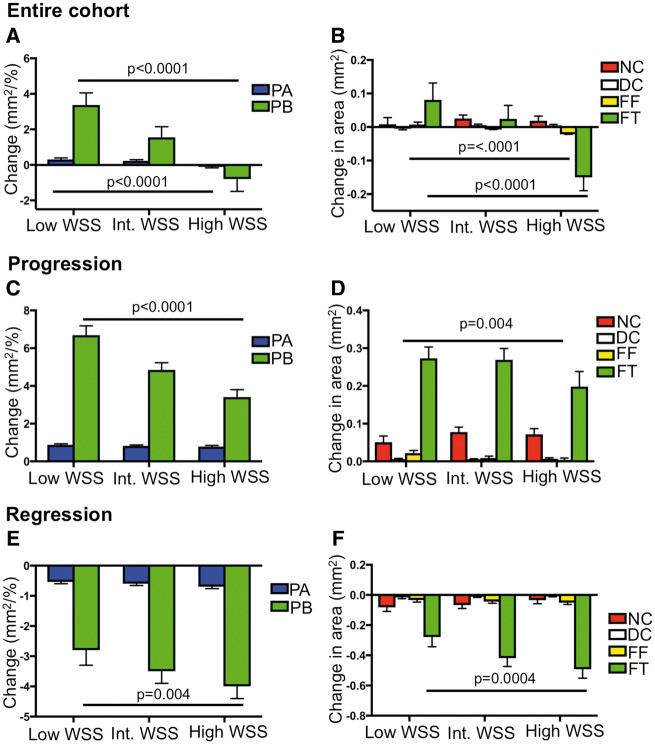
Figure 4.
Change in plaque burden, plaque area, and plaque composition according to wall shear stress. (A and B) Change in plaque area and plaque burden (A) and composition (B) in the entire cohort according to wall shear stress. (C and D) Change in plaque area and plaque burden (C) and composition (D) in areas of progression according to wall shear stress. (E and F) Change in plaque area and plaque burden (E) and composition (F) in areas of regression according to wall shear stress. Data are presented as means ± standard error of mean. Entire cohort (n = 4029). P-values are for low wall shear stress vs. high wall shear stress (only statistically significant values are shown). Figures illustrate the results of linear mixed-effects models (Table 2). DC, dense calcium; FF, fibrofatty; FT, fibrous tissue; NC, necrotic core; PA, plaque area; PB, plaque burden; WSS, wall shear stress.

