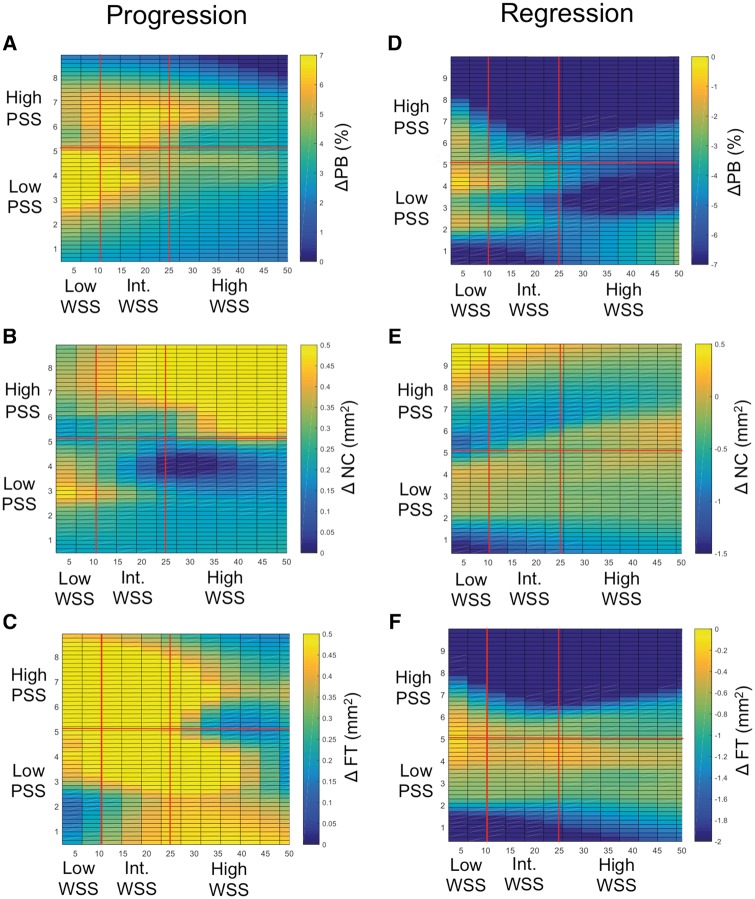
Figure 6.
Plaque structural stress and wall shear stress in areas of progression and regression. (A–C) Heat maps of (A) change in plaque burden, (B) change in necrotic core, or (C) change in fibrous tissue according to wall shear stress and plaque structural stress in areas of progression. (D–F) Heat maps in areas of (D) change in plaque burden, (E) change in necrotic core, or (F) change in fibrous tissue according to wall shear stress and plaque structural stress in areas of regression. Areas associated with low, intermediate, or high wall shear stress (dynes/cm2), and low or high plaque structural stress are marked by red lines. FT, fibrous tissue; NC, necrotic core; PB, plaque burden; PSS, plaque structural stress; WSS, wall shear stress (only frames with plaque burden ≥40% included in the analysis).

