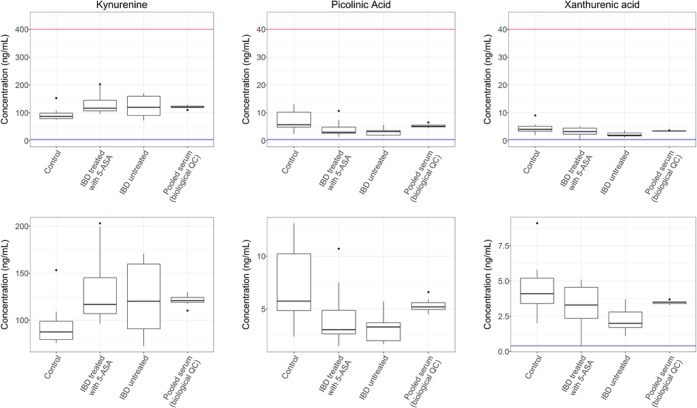
Figure 2.
Box plots presenting three analytes that significantly differ in concentrations between the study groups. The upper box plots show the full analytical range with the lower limit of quantification in blue and the upper limit of concentration in red. The lower box plots present the same data, but the y-axis has been shrunk for clarity. ANOVA analysis revealed significant differences between the control and patient groups for kynurenine (p = 0.043), picolinic acid (p = 0.009), and xanthurenic acid (p = 0.017). Data for the biological QC have been included to show the measurement precision of each metabolite in a repeat biological sample, compared with the variation within the clinical samples.

