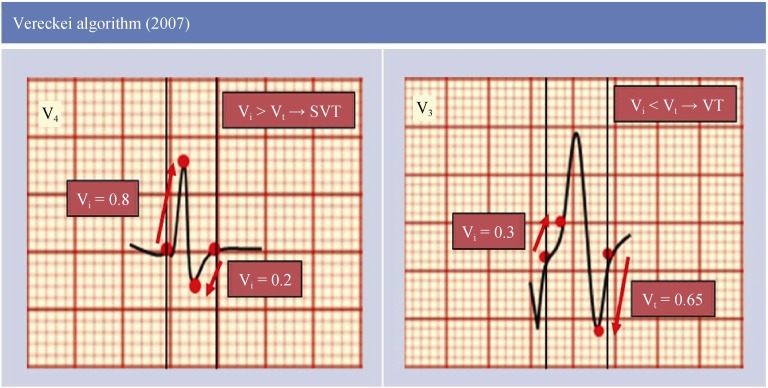
Figure 4. Schematic electrocardiogram representations.
In lead V4 there are vertical lines denoting the onset of QRS complex, the initial and terminal 40 ms of the QRS complex is marked by small red points. During the initial 40 ms of the QRS, the impulse advanced vertically 0.8 mV, then the Vi = 0.8 and during the terminal 40 ms of the QRS, the impulse advanced vertically 0.2 mV, consequently the Vt = 0.2, and thus the Vi/Vt > 1 suggesting the diagnosis of SVT. In lead V3; Vi = 0.3 and Vt = 0.65 in this example, and therefore the Vi/Vt < 1 suggesting the diagnosis of VT. SVT: supraventricular tachycardia; VT: ventricular tachycardia.

