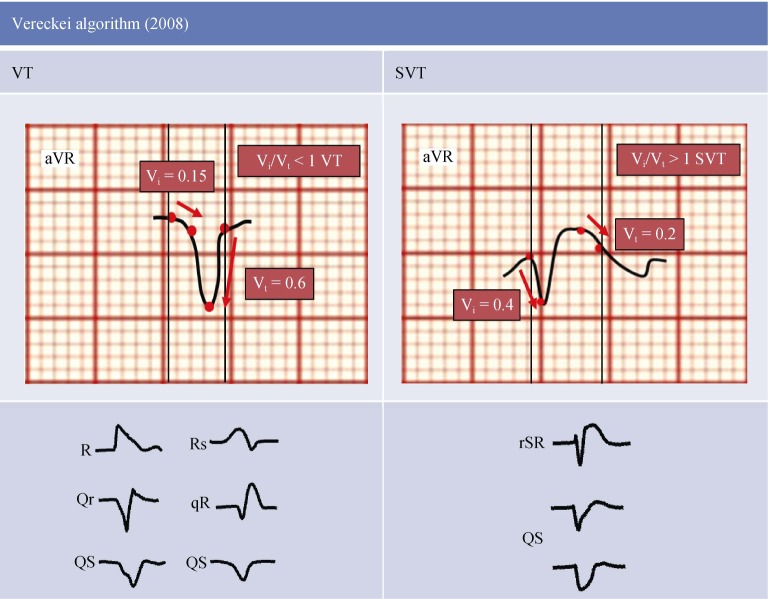
Figure 6. Schematic electrocardiogram representations.
Vi/Vt ratio criterion in the fourth step of the aVR algorithm. In the inferior part, most common lead aVR electrocardiogram patterns in SVT and VT.[8] SVT: supraventricular tachycardia; VT: ventricular tachycardia.

