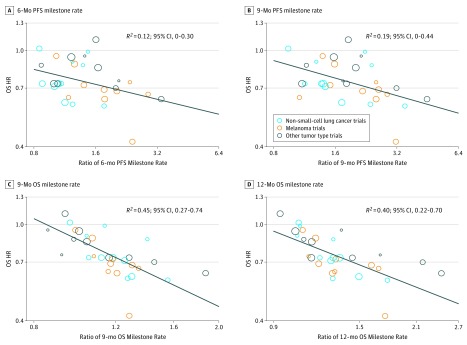
Figure 2. Correlation of Treatment Effects on the Overall Survival (OS) Hazard Ratio (HR) With the Ratios of OS or Progression-Free Survival (PFS) Milestone Rates.
A, Correlation of treatment effects on OS HR with the ratio of 6-month PFS milestone rate. B, Correlation of treatment effects on OS HR with the ratio of 9-month PFS milestone rate. C, Correlation of treatment effects on OS HR with the ratio of 9-month OS milestone rate. D, Correlation of treatment effects on OS HR with ratio of the 12-month OS milestone rate. Size of circles indicates size of trial (ie, larger circle indicates more participants).

